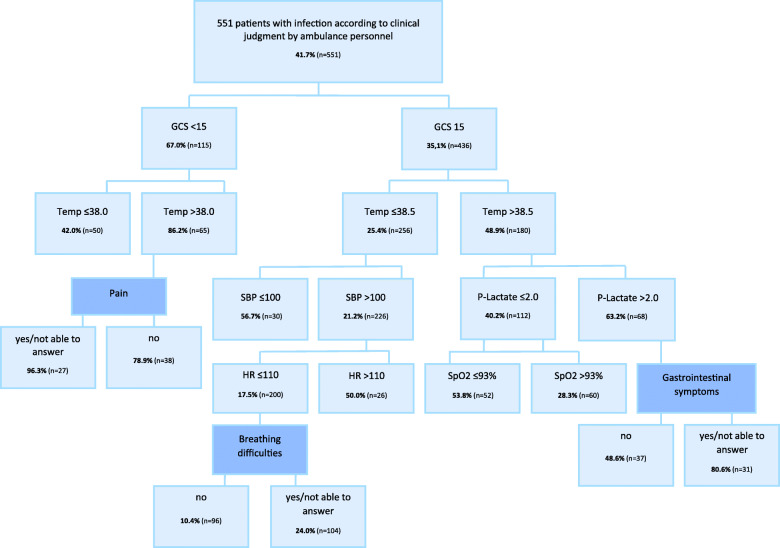
Fig. 2.
Classification treeα presenting the variables which, at each step, had the strongest association with sepsis*. GCS = Glasgow Coma Scale, Temp = Temperature, SBP=Systolic Blood Pressure, HR = Heart Rate, SpO2 = Saturation of peripheral Oxygen, CHAID = Chi-square Automatic Interaction Detector. αThe CHAID algorithm was used to build the tree. *among 551 adult patients with infection according to clinical judgment by ambulance personnel and documentation of to determine whether the patient had sepsis or not. The prevalence of sepsis is bolded and calculated based on the total number of patients in each node (n). Darker blue filling of the box indicates a keyword reflecting medical history. Interpretation; example: “Of the 115 patients with a decreased level of consciousness (GCS<15), 67% had sepsis. If the patients also had fever (Temp>38.0°C), the prevalence of sepsis increased to 86% of the 65 in this group”. All Bonferroni-adjusted values were < 0.05 for all nodes

