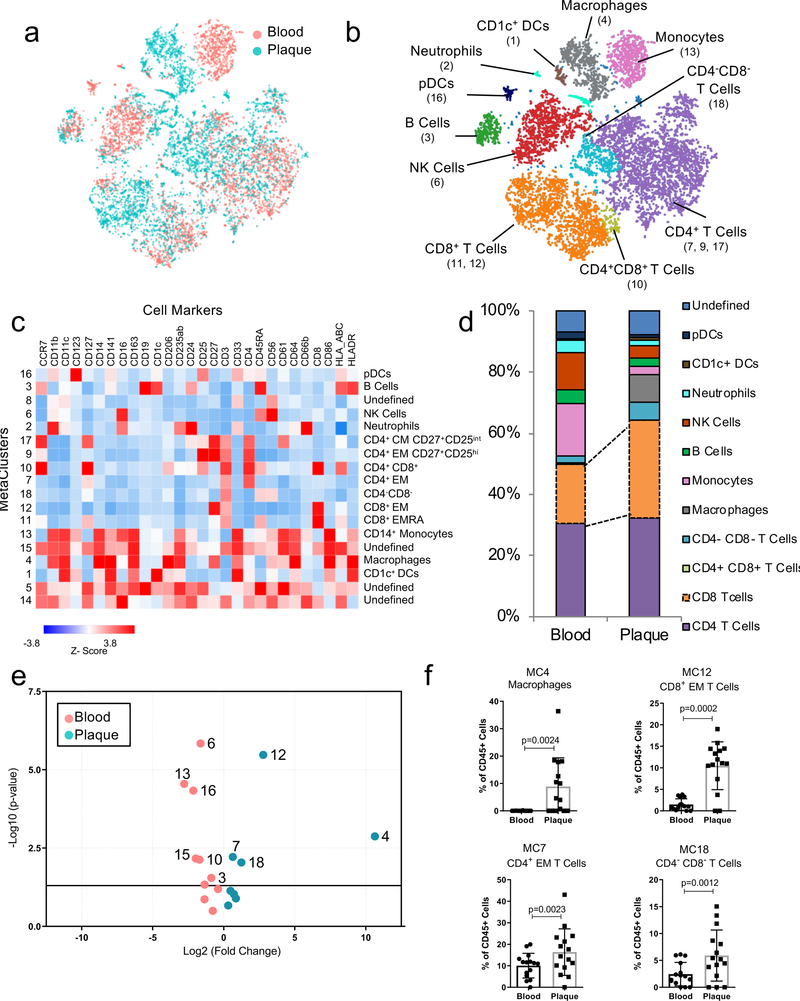
Figure 1. T cells and macrophages dominate the atherosclerotic plaque immune landscape.
MetaLouvain clustering of CD45+ cells derived from blood and plaque tissue (n=15 patients). Representative ViSNE plots of Louvain clustered immune cells (n= 9,490) overlaid with tissue type (a) or immune cell populations (b). Parentheses indicate the MetaCluster (MC) Community. (c) Heatmap of normalized, Z-scored protein expression of MC data, relating the MC communities (left) found across both tissue types to the expression of protein markers (top) and the annotated cell types (right). (d) Bar chart of the relative frequency of immune cell types derived from aggregated MC data in blood and plaque. pDC, plasmacytoid dendritic cell; DC, dendritic cell. (e) Volcano plot of the fold change of MC frequency in plaque and blood from 15 patients. P values were calculated using a paired, two-sided Student’s t-Test and FDR corrected using Benjamini-Hochberg. (f) Scatter bar plots of plaque-enriched MCs from 15 patients, showing the MC frequency stratified by tissue type. MCs are annotated by their cell type. Data were analyzed with the two-sided Wilcoxon test. Values are mean ± SD.

