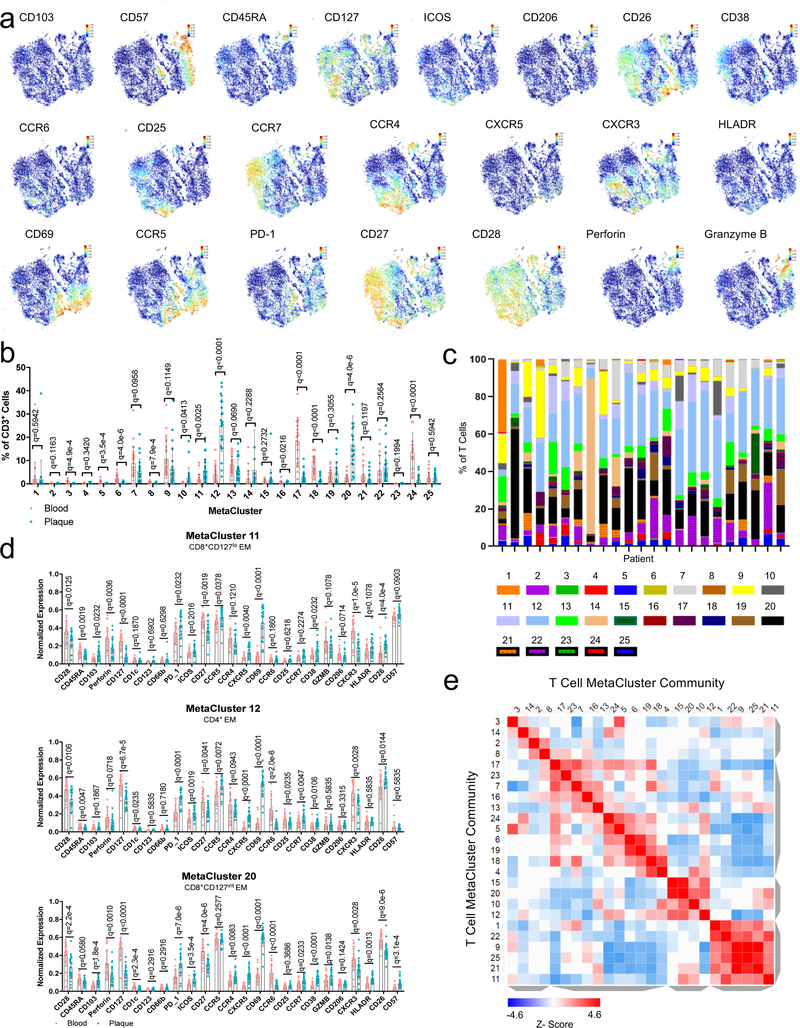
Extended Data Fig. 4. Definition of the T cell compartment from Cohort 2.
(a) viSNE plots of Louvain clustered T cells (n=10,000 cells) overlaid by the protein marker expression in spectral colors. (b,) Scatter bar plots of T-cell MC frequencies in blood and plaque of n=23 patients. (c) Bar chart of MC frequencies per patient of the 23 patients. (d) Scatter bar plots of normalized surface marker expression of plaque-enriched MCs in blood and plaque. Statistical significance for (b) and (d) were determined using multiple unpaired two-sided Student’s t-tests corrected by two-stage linear step procedure of Benjamini, Krieger and Yekuteli with FDR=0.5%. For all scatter bar plots, values are mean ± SD. (e) Similarity matrix of T cell MetaClusters based on the cosine distance method

