
Extended Data Fig. 10. Protein-Ligand Interactions.
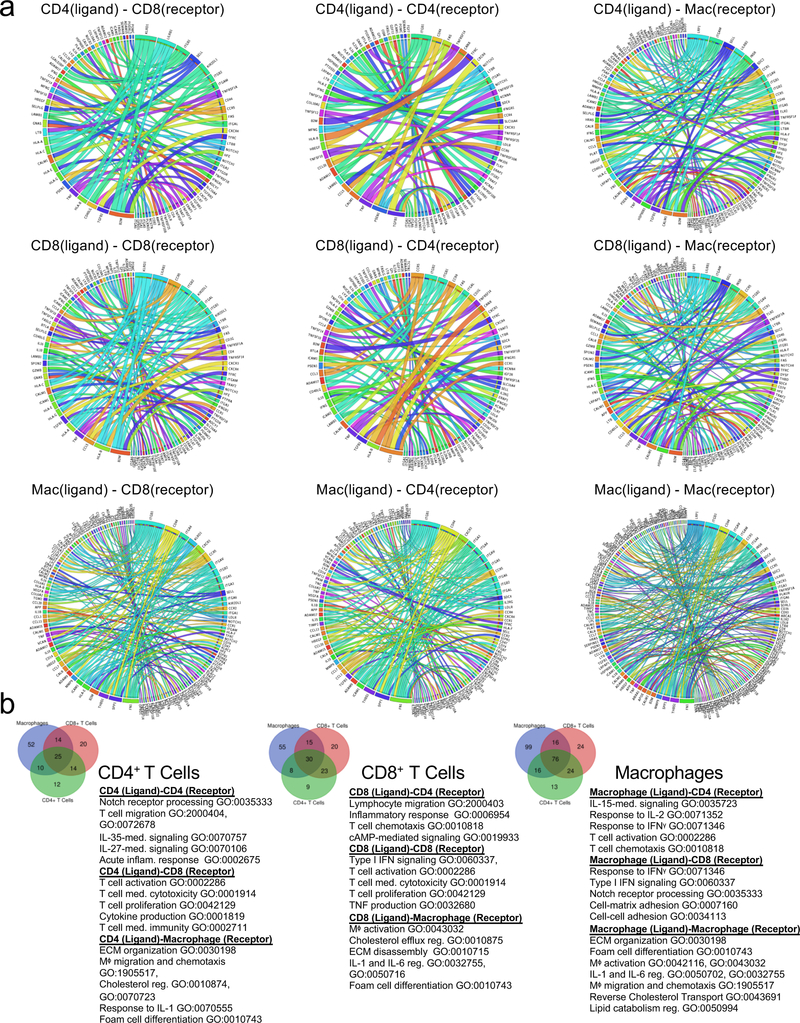
(a) Circos plots of the significant ligand-receptor interactions between cell types, mediated by CD4+ T cells (top row), CD8+ T Cells (middle row), or macrophages (bottom row). (b) Venn diagrams of ligand-receptor pairs from the top 5000 genes (>0.5 Log2 fold change) show unique and overlapping paired between cell-types. Gene Ontology terms were identified for each group using Enrichr.