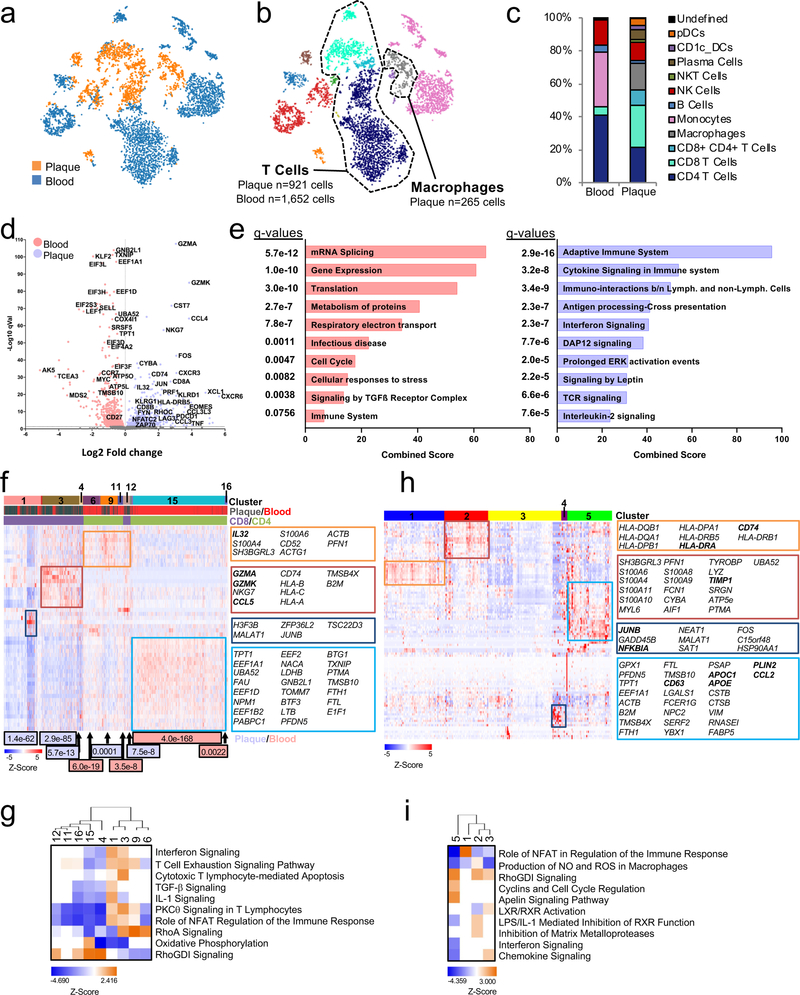
Figure 3. Combined epitope and transcriptomic analysis of paired atherosclerotic plaque and blood using CITE-seq.
(a, b) viSNE plots (n=5,362 cells) clustered by Antibody Derived Tag (ADT) expression and overlaid with tissue (a) or immune cell (b) type. (c) Bar chart of cell type frequencies in blood and plaque. (d-i) CITE-Seq gene expression data from T cells (plaque n=921; blood n=1,652) and macrophages (n=265). (d) Volcano plot of the top 5000 Differentially Expressed Genes (DEGs) (determined by two-sided Welch’s T- Test and Benjamini-Hochberg correction) in T cells of plaque or blood. (e) Pathway analysis of T cell DEGs with q<0.05 (n=1,570 genes) upregulated in blood (left) and plaque (right). The combined score metric corresponds to the P value (two-sided Fisher’s exact test) multiplied by the Z-score of the deviation from the expected rank, and q values determined by Benjamini-Hochberg correction. Heatmap of hierarchically clustered (f) top 50 variable genes across T cells (n=2,573 cells) in plaque and blood, and (h) top 100 variable genes across macrophages (n=265 cells). Rows: z-scored gene expression values; columns: individual cells. Heatmap categories (above) of identified cell clusters. (f), the middle category indicates the cell’s origin from plaque or blood; the bottom category indicates the cluster’s identity as CD8+ or CD4+ T cells. Cluster enrichment in tissue type is displayed below the heatmap with p values (two-sided binomial proportions test). Boxes (right) list key genes found in clusters. (g, i) Canonical signaling pathway analysis of the top 5000 DEGs in the indicated cell clusters from T cells (g) and macrophages (i).

