
FIGURE 6.
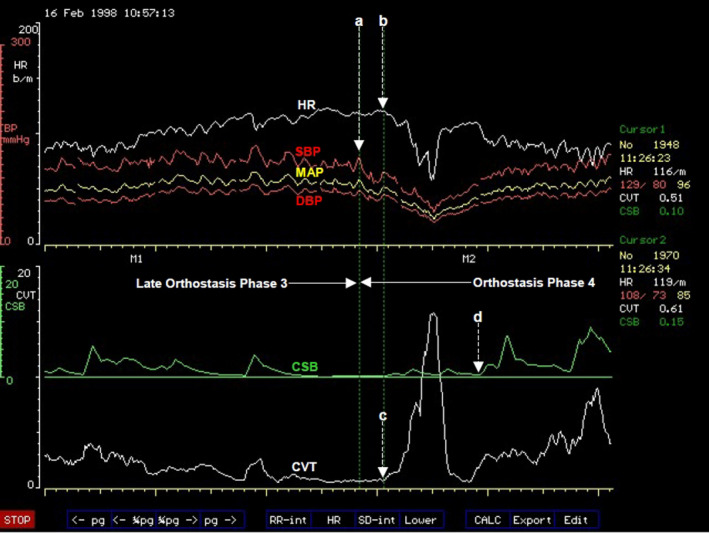
A computer screen capture from the NeuroScope displaying the following beat‐to‐beat traces of cardiovascular parameters at the transition from orthostasis Phase 3 to Phase 4. Heart rate (HR) expressed in beats.min−1; systolic (SBP), diastolic (DBP), and mean arterial blood pressures (MAP) measured in mmHg; cardiac sensitivity to baroreflex (CSB) measured in ms.mmHg−1 and cardiac vagal tone (CVT) measure in units of a linear vagal scale (LVS) (see text for descriptions and methods used to measure these cardiovascular parameters). Note the sudden and progressive decrease in blood pressure at the beginning of a vasodepressor response at (a). This was followed 11 s later by a progressive bradycardia starting at (b) in a cardiodepressor response. The bradycardia in the cardiodepressor response coincides with the beginning of a sudden rise of CVT at (c) during which CVT is reset from its very low level to an exaggerated high level. CSB was reset much later at (d) (see text for full explanation)