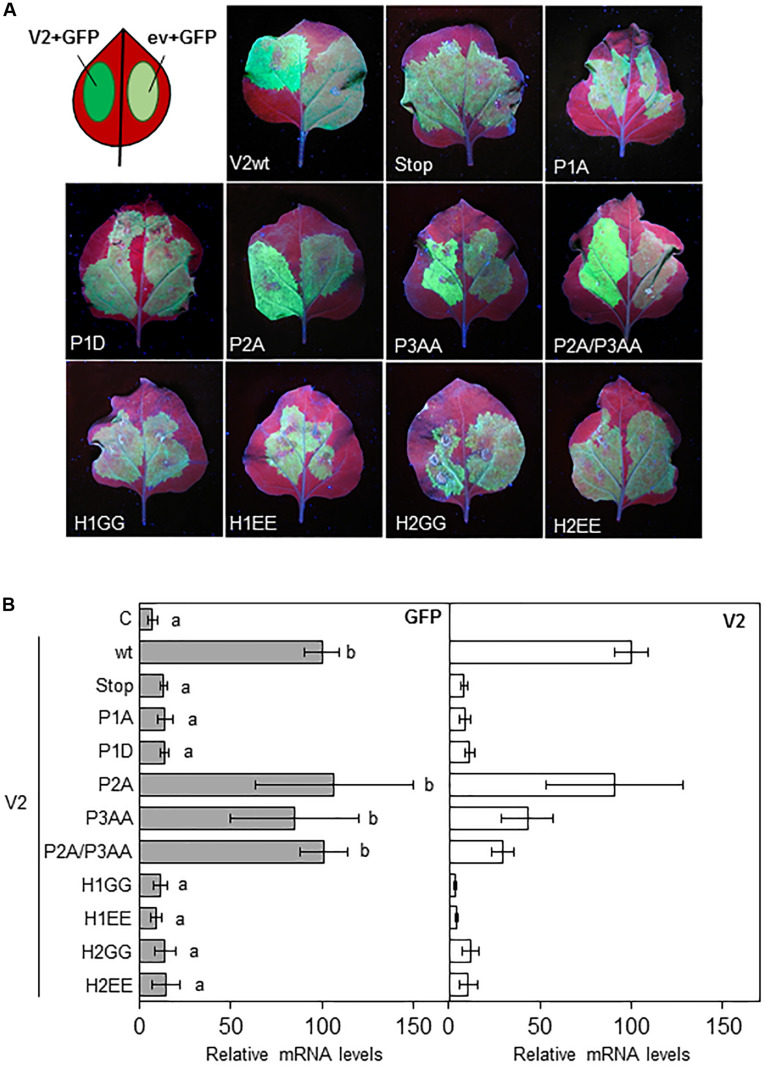
FIGURE 2.
Local PTGS suppression activity of V2 mutants in wild-type N. benthamiana plants. (A) Leaves from N. benthamiana plants infiltrated with a mixture of two A. tumefaciens cultures expressing GFP and the indicated version of V2, were photographed under UV light at 5 dpi. Wild-type V2 protein (wt) and the empty vector (C) were used as a positive and negative control, respectively. (B) Relative GFP and V2 mRNA levels (RT-qPCR) in infiltrated tissues at 5 dpi. GFP or V2 transcript levels were normalized to EF1 and are presented as the relative amount of transcripts compared with the amount found in wild-type V2 (wt) samples (set to 100%). Bars represent mean values ± standard error (SE) for 4–8 pools of two leaves from 3 to 4 plants each one. Mean values marked with different letter (a or b) indicate results significantly different from each other, as established by One Way ANOVA (Dunnett’s Multiple Comparison Test; P < 0.05).

