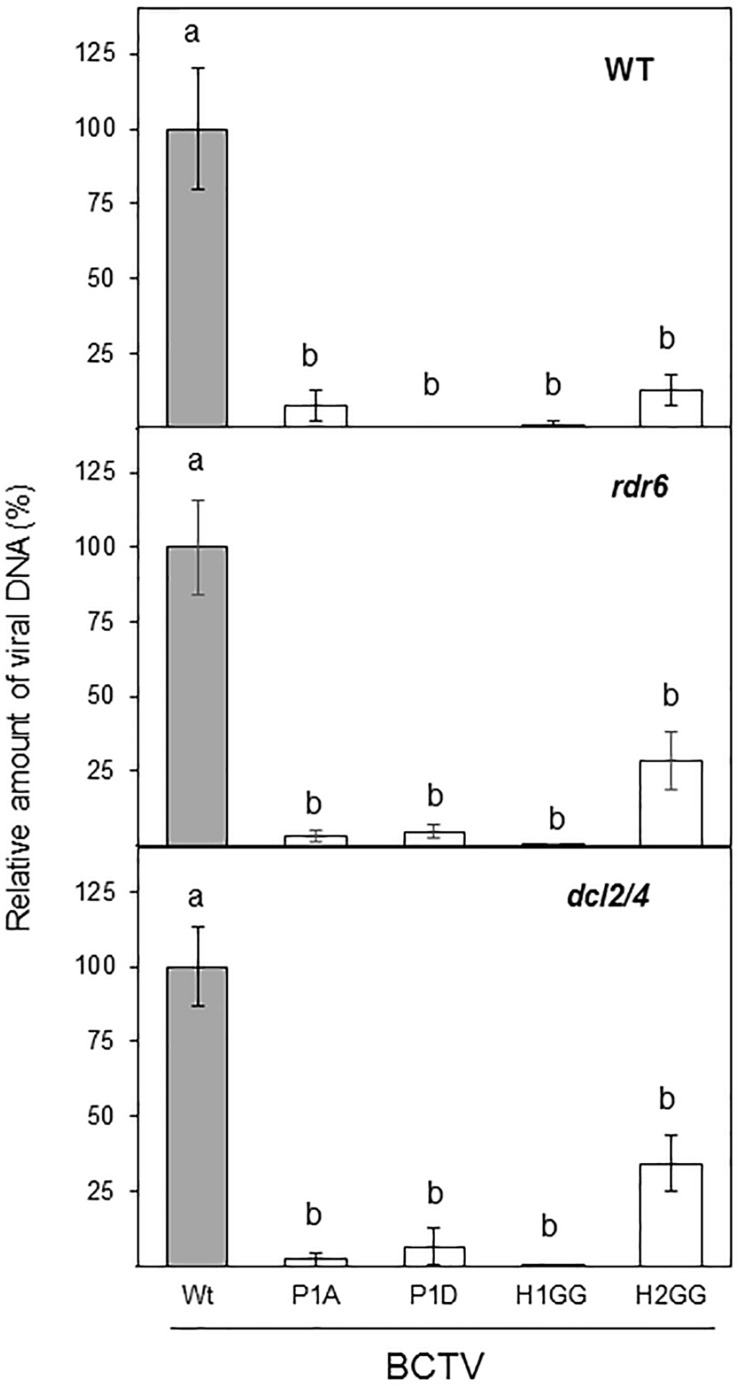
FIGURE 7.
Infection of A. thaliana wild-type (WT), dcl2/4 (dcl2-1/dcl4-2) and rdr6 (rdr6-15) mutants with wild-type or BCTV V2 mutants. The relative viral DNA accumulation at 28 dpi was quantified by qPCR in WT, rdr6 and dcl2/4 backgrounds. DNA levels were normalized to actin gene and are presented as the relative amount of virus compared with the amount found in wild-type BCTV (wt) samples (in gray, set to 100%). Bars represent mean values ± standard error (SE) for eight to twelve plants per biological replicate. Data from three biological replicate are shown. Mean values marked with different letter (a or b) indicate results significantly different from each other, as established by One Way ANOVA (Dunnett’s Multiple Comparison Test; P < 0.05).

