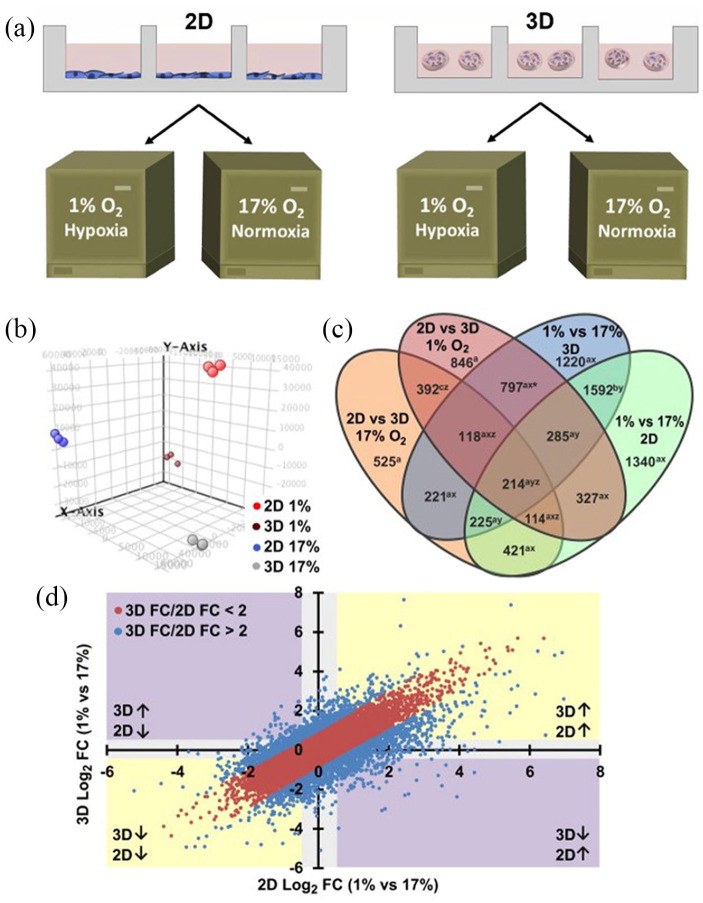
Figure 5.
Schematic diagram of cell culture model and overall changes in gene expression under different conditions. (a) OSCC-3 cells were cultured in traditional 2D monolayer cell cultures or microfabricated alginate disks and incubated in normoxia (17% O2) or hypoxia (1% O2) condition for a week, respectively. (b) GeneSpring GX 12.6.1 software was used to in principal component analysis (PCA) of microarray results. Each substrate assembling and oxygen concentration demonstrated the dependability of every treatment to produce autonomous and self-reliable gene expressed patterns. (c) Genes were related to dimensionality as well as oxygen level variations according to Venn diagram. (d) The 2D hypoxia vs normoxia (x-axis) and 3D hypoxia vs normoxia (y-axis) scatterplots indicate the degree (FC: fold change) and trend (↑ and ↓: up- and down-regulation, respectively) of gene expression variations. Reproduced with permission from DelNero et al.121 (2015, Biomaterials).

