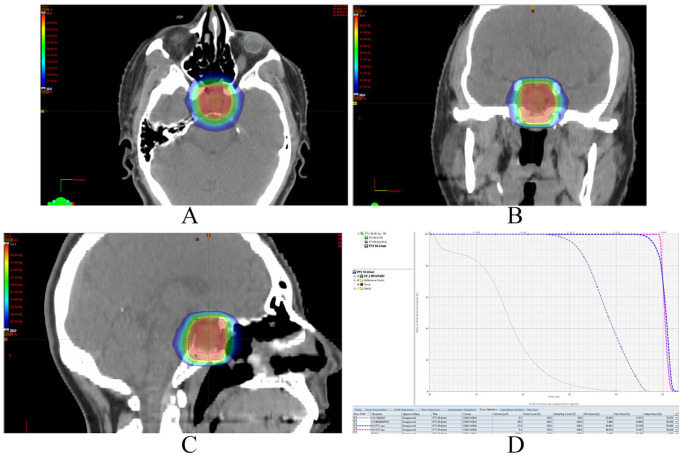
Figure 1.
Pituitary adenoma IMRT planning pictures: (A) axial image, (B) coronal image, (C) sagittal image, (D) dose volume histogram (DVH) showing dose received per volume by targets and organs at risk.
Pink continuous line represents gross target volume (GTV) and dark blue line shows planning target volume (PTV).
Red radiation dose cloud shows 100%, whereas dark blue cloud at edges shows 50% of prescribed dose.

