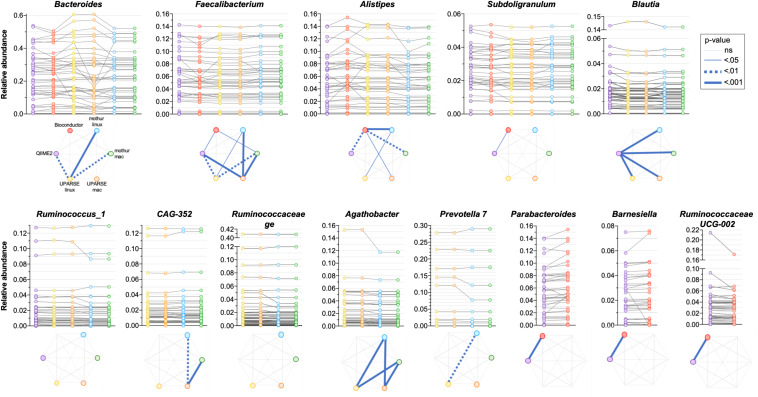
FIGURE 5.
Comparison of the relative abundance of the 10 most abundant genera obtained by applying QIIME2, Bioconductor, UPARSE, or mothur at genera level. p-Values were calculated using Friedman test followed by Dunn’s multiple comparisons test. Wilcoxon signed rank test was applied when only two pipelines were compared.

