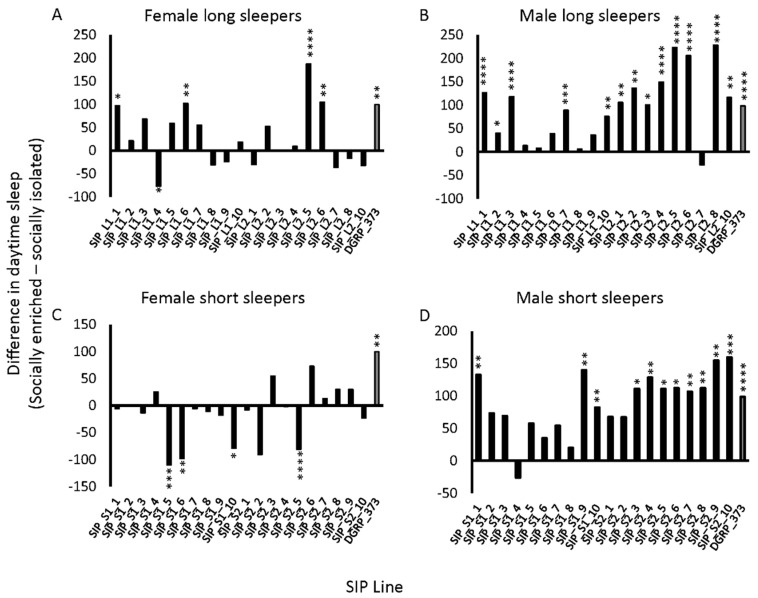
Figure 3.
Variable response to social enrichment in the SIP. The difference in average day sleep under socially enriched and isolated conditions is plotted for (a) female long sleepers; (b) male long sleepers; (c) female short sleepers; and (d) male short sleepers. DGRP_373 is plotted as gray bars. * 0.01 ≤ p < 0.05; ** 0.001 ≤ p < 0.01; *** 0.0001 ≤ p < 0.001; **** p < 0.0001.

