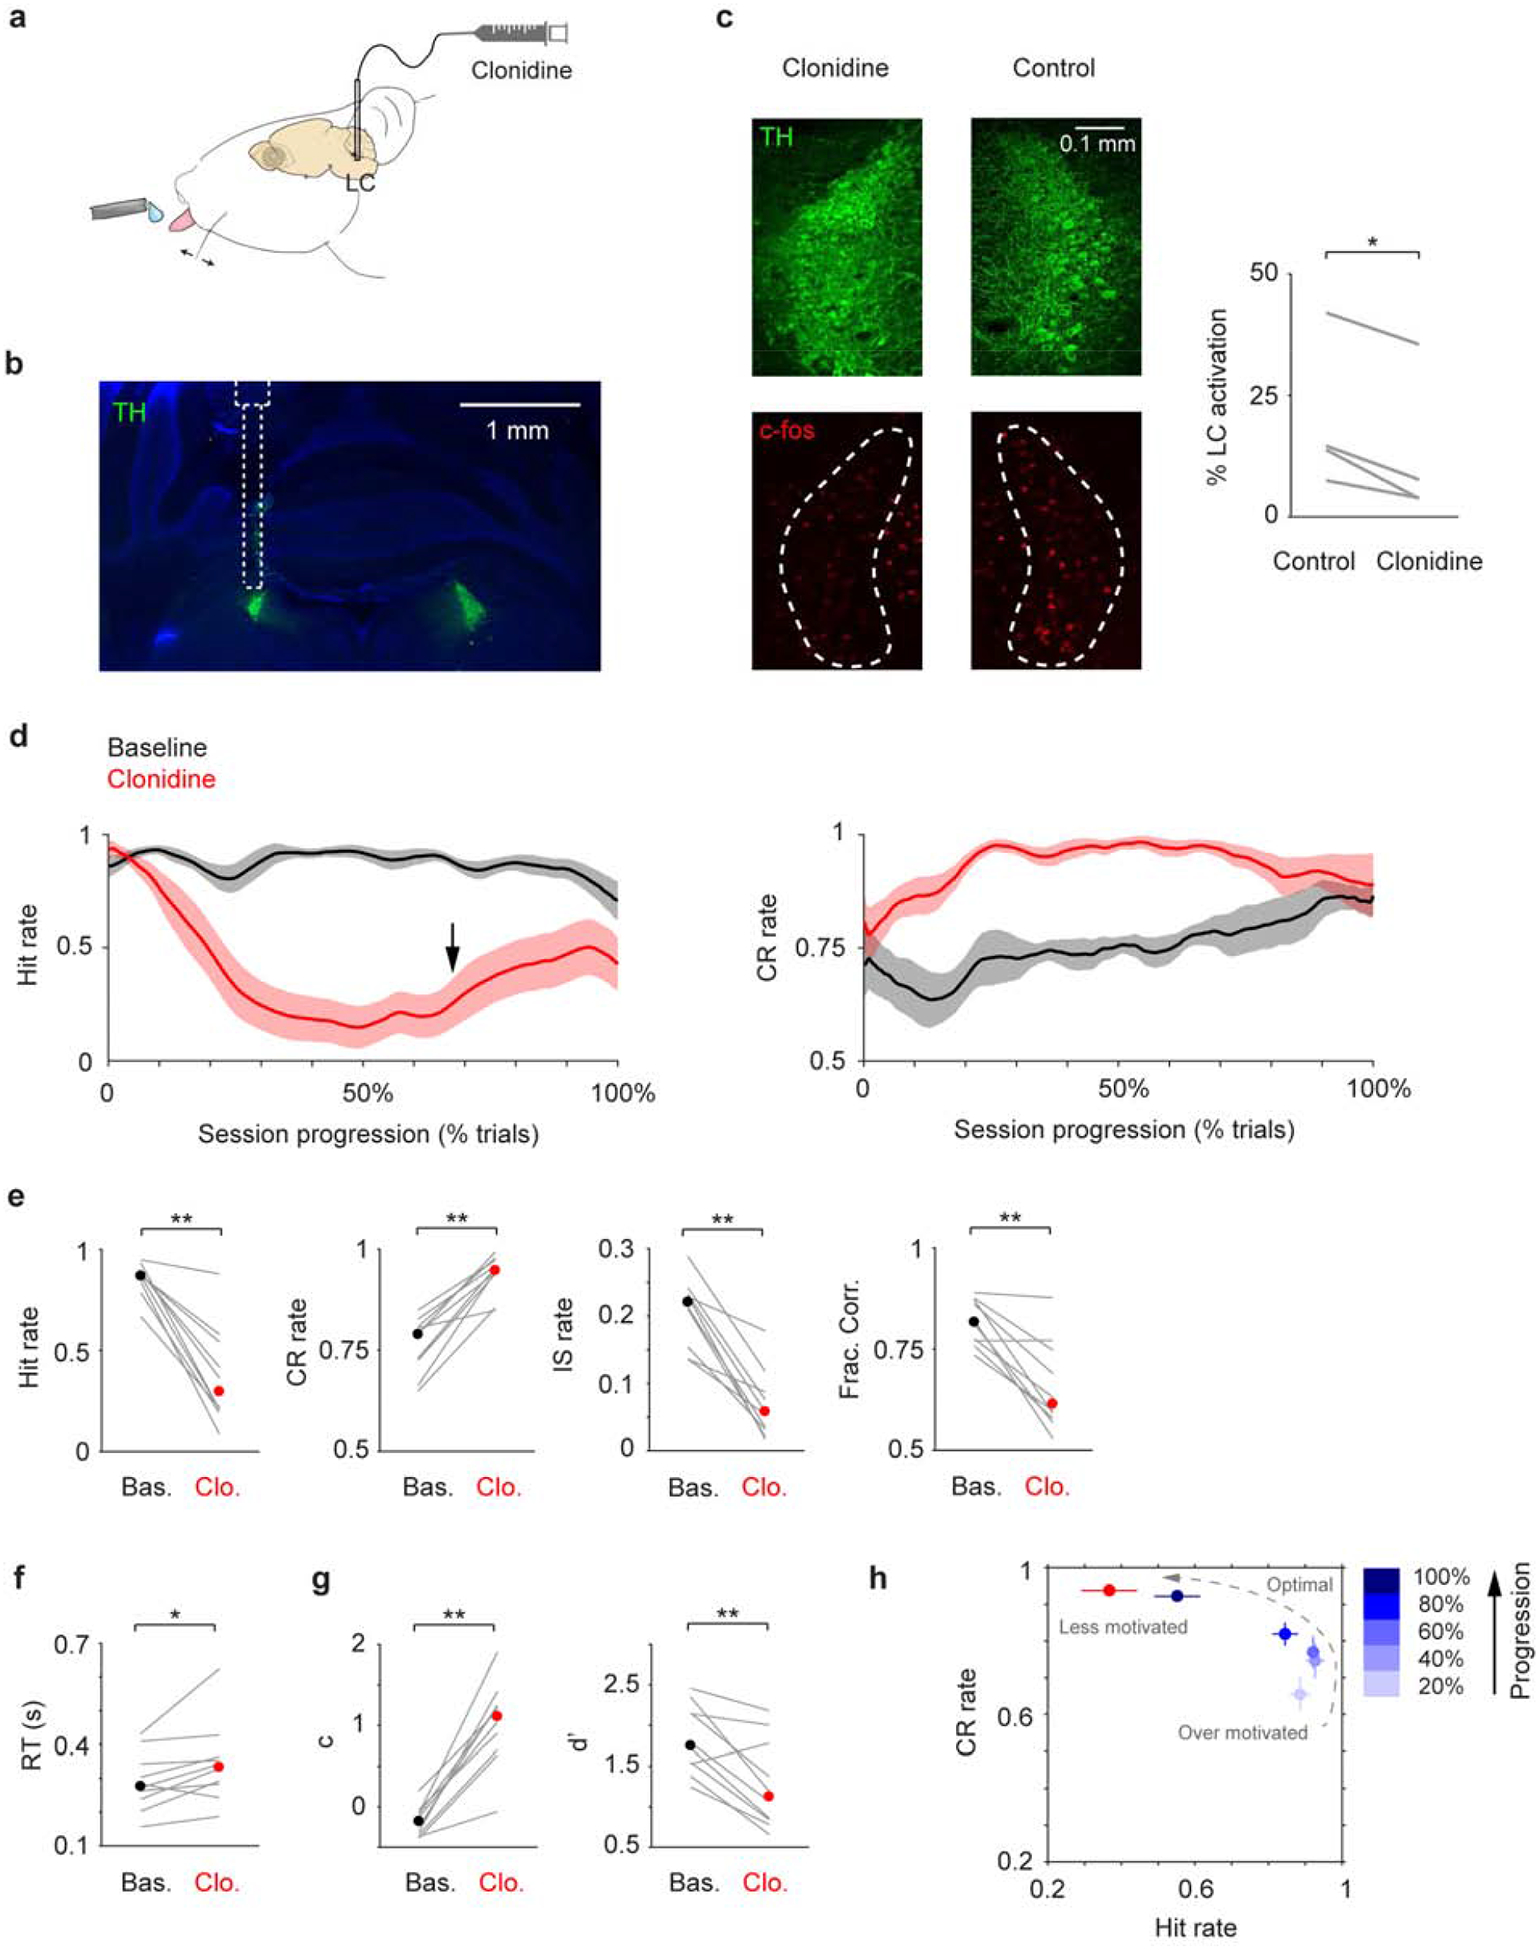
Figure 2.

Localized clonidine infusion impairs tactile detection. a. Schematic of drug infusion setup. b. Histological section showing LC (green) and the tract of the infusion cannula, overlaid with an illustration of cannula placement. c. Left: Example c-fos expression (red) in the LC (green) after localized clonidine infusion. The contralateral LC serves as a basal level control. Right: c-fos expression was reduced upon clonidine infusion in 4 awake mice (P = 0.014, two-tailed paired t-test. Cell counts for individual mice are shown in Table 1). % LC activation was defined as the fraction of TH/c-fos double positive cells among TH positive cells. d. Mean single-session trajectories for Hit (left) and CR (right) rates during baseline and clonidine sessions (± s.e.m.). Baseline sessions were recorded one day before infusion. Black arrow indicates the onset of Hit rate recovery. e-g. Hit rate, CR rate, IS rate, Fraction Correct, RT, decision bias (c) and detection sensitivity (d’) for baseline (black dot, median) and clonidine (red dot, median) sessions. Gray lines indicate individual consecutive two-day, baseline-clonidine pairs. Hit rate, P = 0.002, Signed rank = 55; CR rate, P = 0.002, Signed rank = 0; IS rate, P = 0.002, Signed rank = 55; Frac. Corr., P = 0.0039, Signed rank = 54; RT, P = 0.019, Signed rank = 5; c, P = 0.002, Signed rank = 0; d’, P = 0.0059, Signed rank = 53. n = 10. h. CR rate vs. Hit rate trajectory showing clonidine reduces motivation (low Hit rate and high CR rate), which coincides with mouse behavior toward the end of normal baseline sessions. n.s., P > 0.05; * P < 0.05; ** P < 0.01.
