Figure 1.

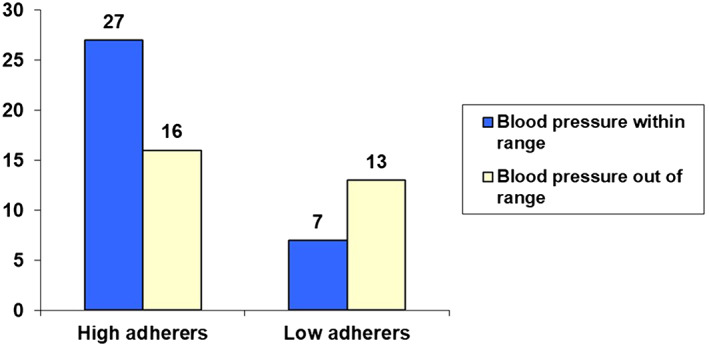
Bar chart of “high adherers” vs “low adherers” as a function of clinical outcome (blood pressure within or out of range) in the Hypertension B group

Bar chart of “high adherers” vs “low adherers” as a function of clinical outcome (blood pressure within or out of range) in the Hypertension B group