Figure 3.

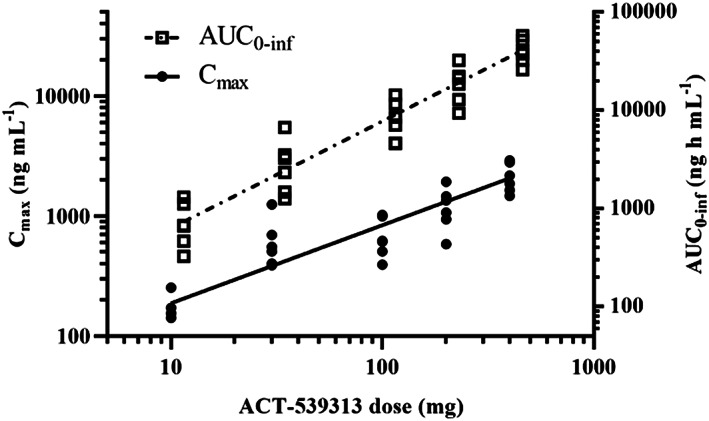
Graphical representation of dose proportionality of area under the concentration–time curve extrapolated to infinity (AUC0‐inf) and the less than dose‐proportional increase of maximum plasma concentration (Cmax) for ACT‐539313

Graphical representation of dose proportionality of area under the concentration–time curve extrapolated to infinity (AUC0‐inf) and the less than dose‐proportional increase of maximum plasma concentration (Cmax) for ACT‐539313