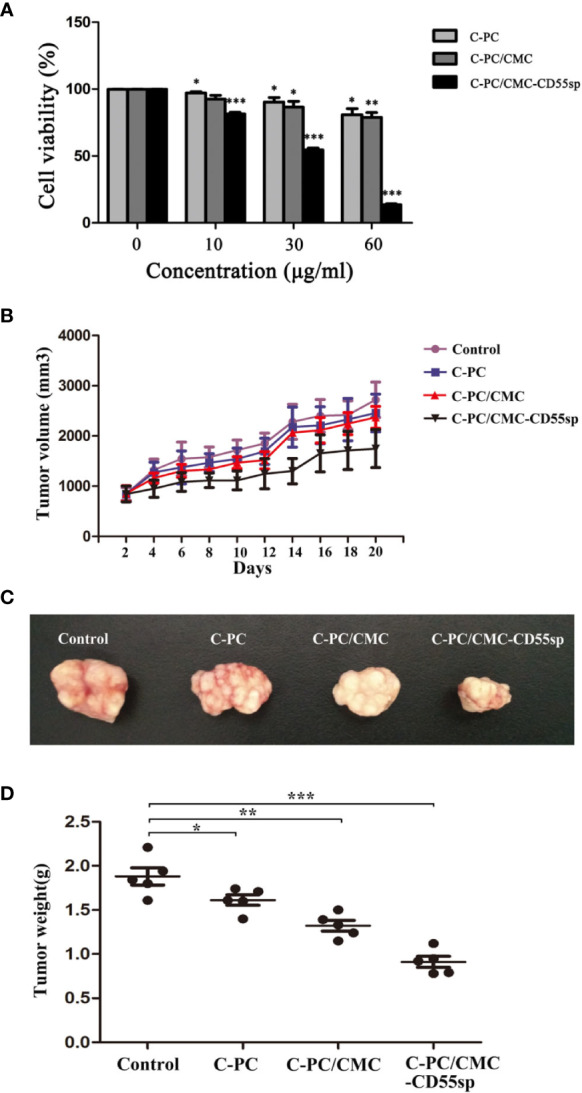
Figure 4.

Inhibitory effects of drugs on cell proliferation in vitro and in vivo. (A) Cell Counting Kit-8 (CCK-8) assay. The x-axis represents drug concentration (0, 10, 30, and 60 μg/ml), and the y-axis represents cell activity, as determined using the CCK-8 assay. Results are expressed as the mean ± SEM (n = 3). *P < 0.05, **P < 0.01, ***P < 0.001. (B) Tumor volume. The horizontal axis represents days and the vertical axis represents tumor volume (mm3). (C) Tumor size. (D) Tumor weights. The vertical axis represents tumor weights (g). Results are expressed as the mean ± SEM (n = 5). *P < 0.05, **P < 0.01, ***P < 0.001.
