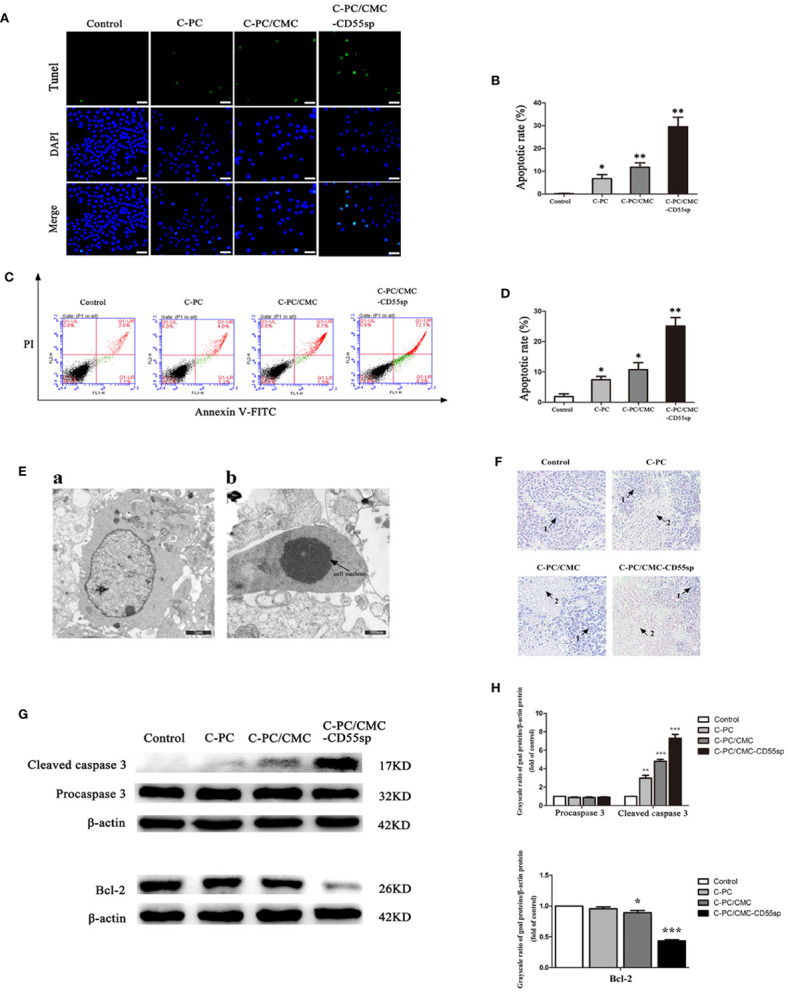
Figure 5.

Drug-induced apoptosis. (A, B) TUNEL assay. Blue fluorescence indicates nuclei, and green fluorescence indicates apoptotic cells. The percentage of apoptotic cells (%) was equal to the ratio of the number of stained cells to the total number of cells. Results are expressed as the mean ± SEM (n = 3). *P < 0.05, **P < 0.01. Scale bars, 20 μm. (C, D) Flow cytometry analysis. Apoptosis was evaluated using an annexin V-FITC and PI apoptosis detection kit. The apoptosis rates of cells were determined, and C-Phycocyanin (C-PC)/CMC-CD55sp nanospheres induced apoptosis to the greatest extent. Results are expressed as the mean ± SEM (n = 3). *P < 0.05, **P < 0.01. (E) Electron microscopy. a. Normal HeLa cells. Scale bars, 2 μm; b. Apoptotic HeLa cells. Scale bars, 500 nm. Arrows indicate nuclei. (F) Hematoxylin and eosin staining. (1) Normal HeLa cells; (2) apoptotic HeLa cells. (G, H) Western blot. Protein levels were normalized to β-actin. Results are expressed as the mean ± SEM (n = 3). *P < 0.05, **P < 0.01, ***P < 0.001.
