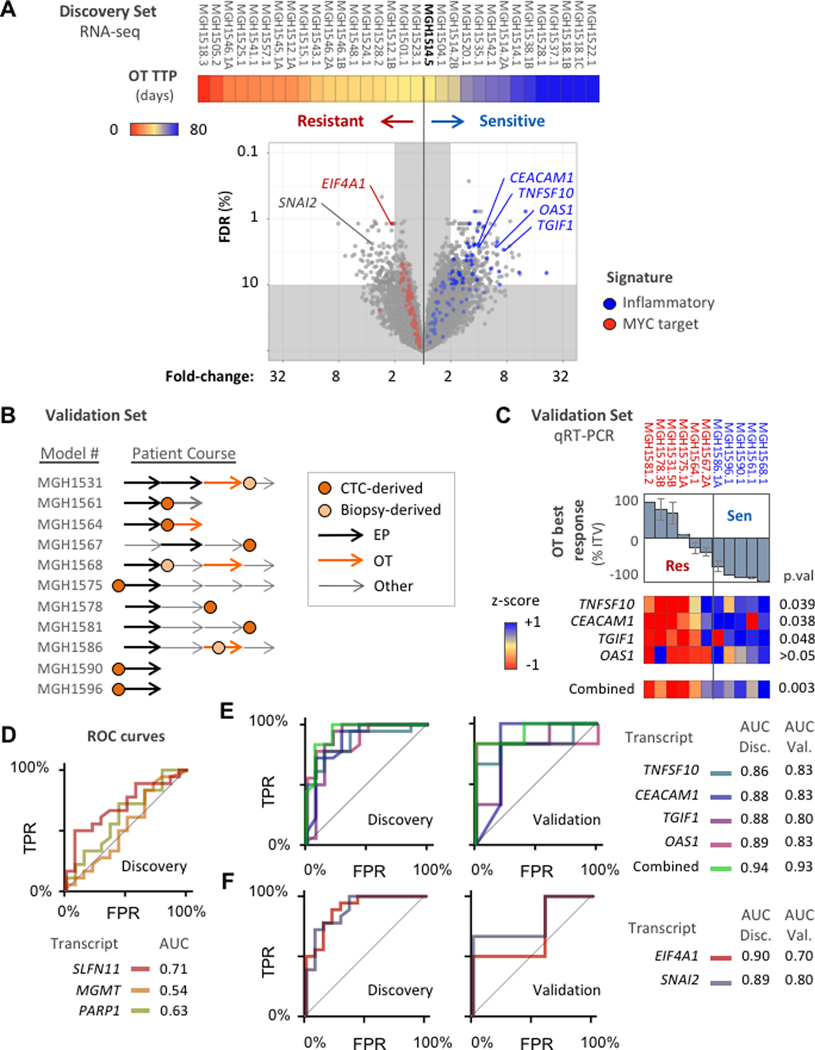
Figure 6. OT expression biomarker analysis.
(A) Volcano plot compares gene expression levels between OT-sensitive and OT-resistant models, Models ordered left-to-right by increasing TTP with OT (color bar, days) and threshold at MGH1514–5. Significance of difference (y-axis) = FDR-adjusted Welch’s t-test p-value (Benjamini-Hochberg method). Magnitude of difference (x-axis) = fold-difference in mean expression values between cohorts. Genes from the cross-resistance signatures in Figure 5E–F are colored: red = MYC target signature, blue = inflammatory signature. (B) Validation set of 11 PDX models treated with OT, with abstracted patient clinical courses as in Figure 4I. (C) Candidate transcripts labeled in (A) from inflammatory signature were measured by qRT-PCR across the validation set and compared with OT response. Top: waterfall plot of model best response (mean), with threshold from discovery set model MGH1514–5 (−40%). Bottom: heatmap of candidate gene expression z-scores, and aggregate z-scores, with unpaired t-test p-values. (D-F) ROC curves and AUC for candidate biomarkers to distinguish OT-sensitive and resistant models based on measurement of transcript abundance. TPR = true positive rate, FPR = false positive rate. (D) Hypothesis-driven biomarker candidates, discovery set only. (E) Inflammatory response signature candidates for OT sensitivity, discovery and validation sets. (F) OT resistance candidates, discovery and validation sets.

