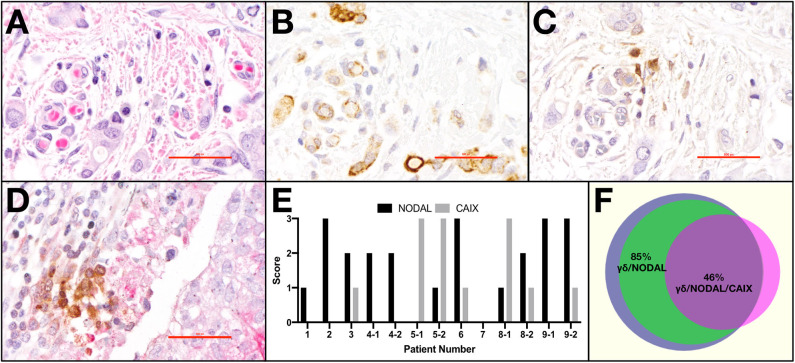
Figure 1.
γδ T cells and NODAL are co-localized in breast tumor tissues from patients. Representative example of paraffin-embedded serial sections from a triple negative breast tumor stained via immunohistochemistry for (A) H&E with hematoxylin staining nuclei dark blue-purple and eosin indicating cytoplasm in pink, (B) NODAL indicated by brown DAB staining, (C) TCRδ also stained brown with DAB, (D) Representative example of TCRδ (brown) found in a CAIX-positive region, stained pink with permanent red dye; scale bar = 40 μm. (E) Scoring for NODAL and CAIX expression in tumor sections in which γδ T cells were identified. Cases in which more than one slide was positive for TCRδ are indicated with −1, −2 designations. (F) Venn diagram depicting co-localization of γδ T cells (blue), NODAL (green), and CAIX (fuchsia). Percent overlaps are indicated.

