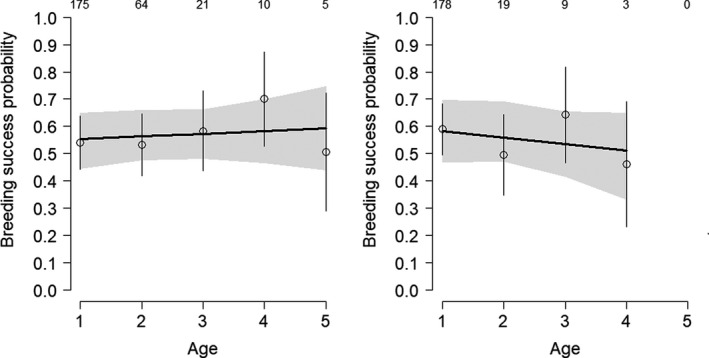
FIGURE 2.

Male (left panel) and female (right panel) age‐specific breeding success in the whinchat. The plain lines represent the predicted relationships obtained from linear models. The open dots show the age‐specific posterior means. The gray‐shaded areas and the vertical lines represent ± standard errors. Sample sizes are placed over the dots
