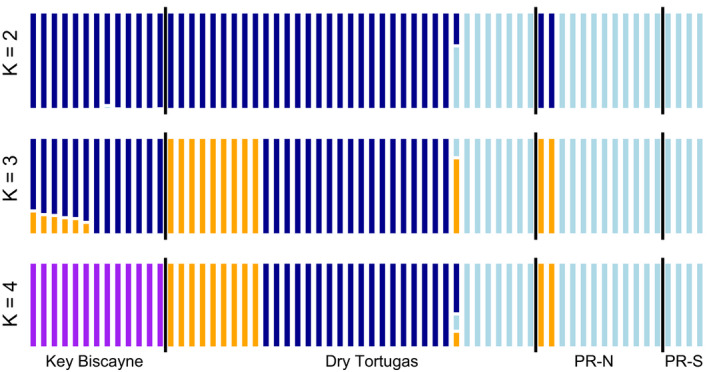
FIGURE 4.

ADMIXTURE results. Results calculated from ADMIXTURE for population assignment at K = 2–4. K = 3 was the best grouping, selected based on the minimum cross‐validation error term. Colors represent ancestry assignment and are independent of colors in other figures
