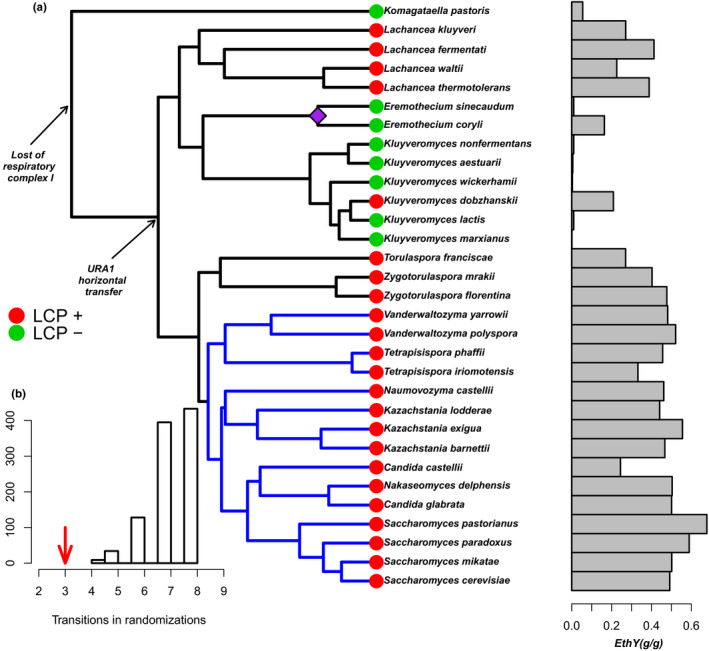
FIGURE 1.

Macroevolutionary patterns in Saccharomycotina. (a) Crabtree‐positive (green) and Crabtree‐negative (red) yeasts associated with fermentative capacity, indicated here as ethanol yield (grams of ethanol production per gram of glucose consumed, horizontal bars). Two major genomic rearrangements that affected the lineage are denoted with the arrows, the purple diamond indicate the loss of the URA1 gene in Eremothecium clade, and the whole‐genomic duplication is indicated by the blue branches. (b) A measure of phylogenetic signal for the Crabtree effect as a categorical trait. The arrow denotes the minimum number of transitions needed to explain the character state, which is significantly less than a randomized distribution (1,000 randomizations; p < .0001). LCP+ = long‐term Crabtree‐positive yeast. LCP− = long‐term Crabtree‐negative yeast
