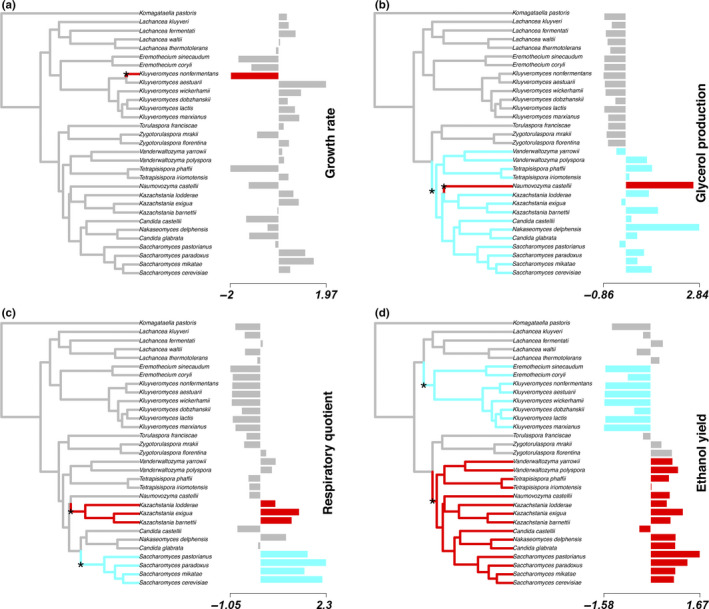
FIGURE 3.

Location of adaptive shifts, according to the OU‐lasso method and assuming a maximum of k = 3 shifts, for each variable: (a) growth rate, (b) glycerol production, (c) respiratory quotient, and (d) ethanol yield. For growth rate, k = 0 and k = 3 were statistically indistinguishable (see Table 1)
