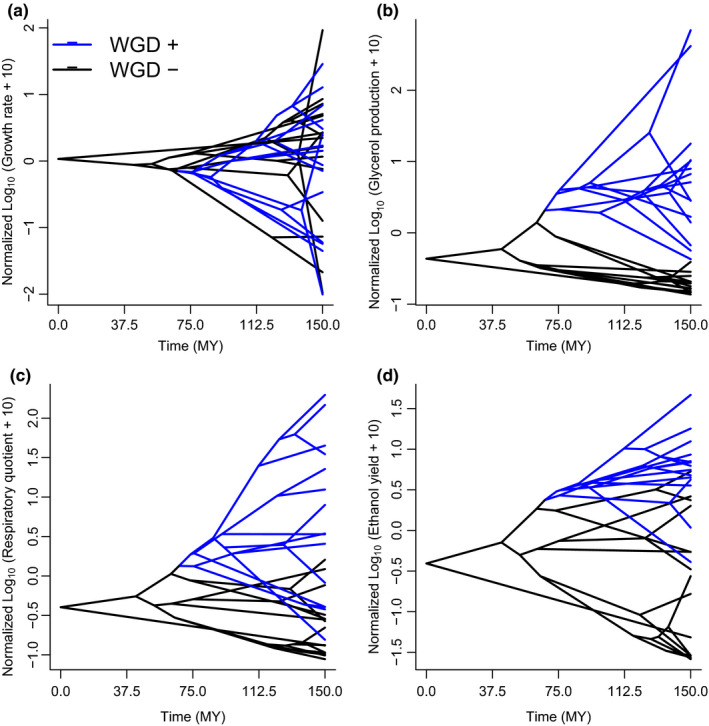
FIGURE 4.

Phenograms (i.e., plots combining trait values and phylogenetic relationship across time) showing the phenotypic differentiation between WGD‐ (black line) and WGD+ (blue line) species, in (a) dry matter growth rate, (b) rate of glycerol production, (c) respiratory quotient, and (d) ethanol yield. The time scale corresponds to the original calibration, ordered backward, where zero represents the origin of the clade
