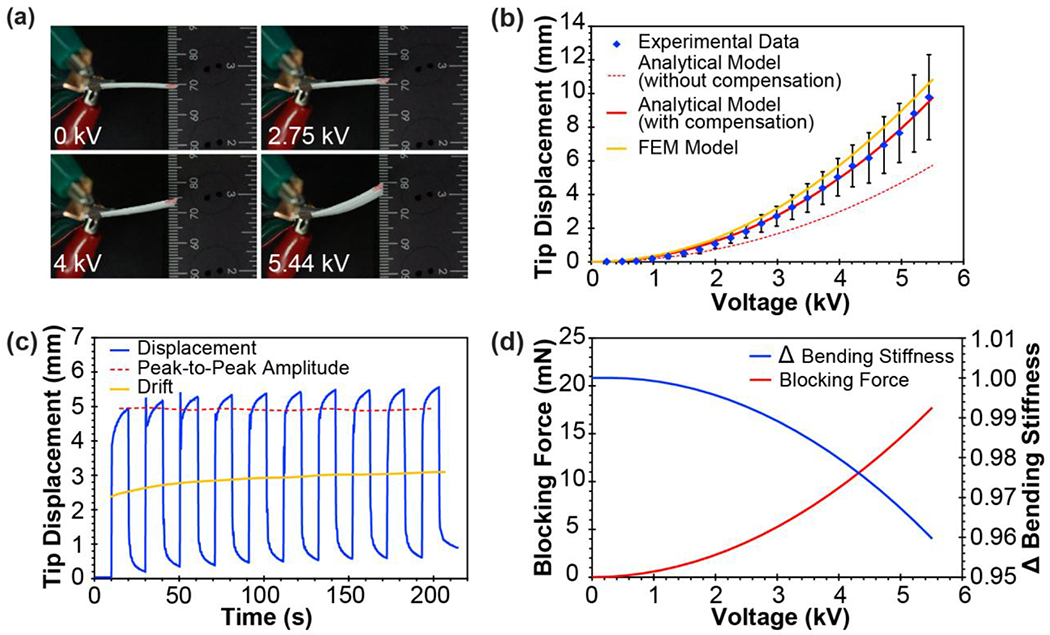
Figure 3.

(a) Stills of device actuation performance at different applied voltages. (b) Experimental results during voltage ramp-up and their comparison with analytical and FEM simulation. Error bars represent standard deviation of the n samples that did not breakdown up to a specific level of the applied voltage. Specifically, n is equal to 5, 4, and 3 for voltage ranges of 0-4.21 kV, 4.47-4.96 kV, and 5.2-5.44 kV, respectively. (c) DEA performance in response to square wave voltage input with an amplitude of 4 kV and frequency of ~ 0.05 Hz. (d) Estimation of DEA blocking force and change in (Δ) bending stiffness as a function of applied voltage using the analytical model.
