Figure 1).

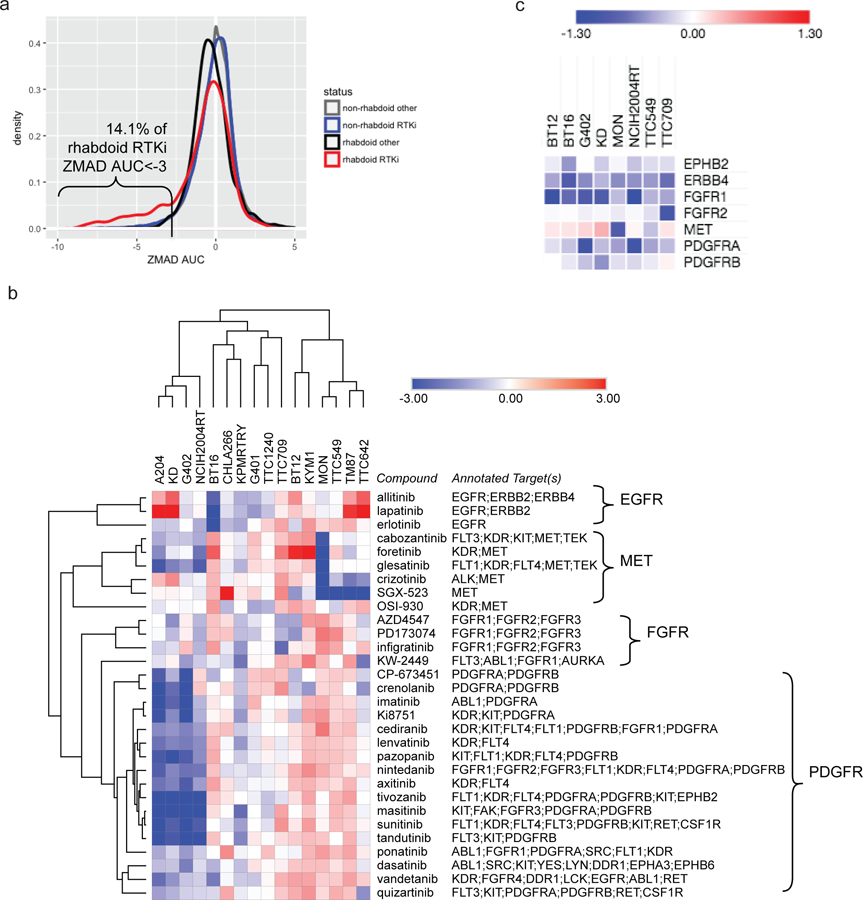
Receptor tyrosine kinases represent vulnerabilities within RT cell lines.
a) ZMAD AUC distributions for 49 annotated RTK inhibitors (and 432 non-RTK inhibitors) across 8 RT cell lines and 879 non-RT cell lines (see Figure S1a–c, Table S1). b) z-scored AUC values for 30 RTK inhibitors across 16 RT CCLs (see Table S1). c) CERES scores for 7 RTK-encoding genes with a CERES score < −0.5 and ZMAD CERES < −2 (in RT relative to 35 non-RT CCLs) in ≥1 RT CCL (see Figure S1e, Table S3). Visualization and hierarchical clustering of rows and columns (1 – Pearson correlation) were performed using Morpheus (https://software.broadinstitute.org/morpheus/).
