Figure 3).

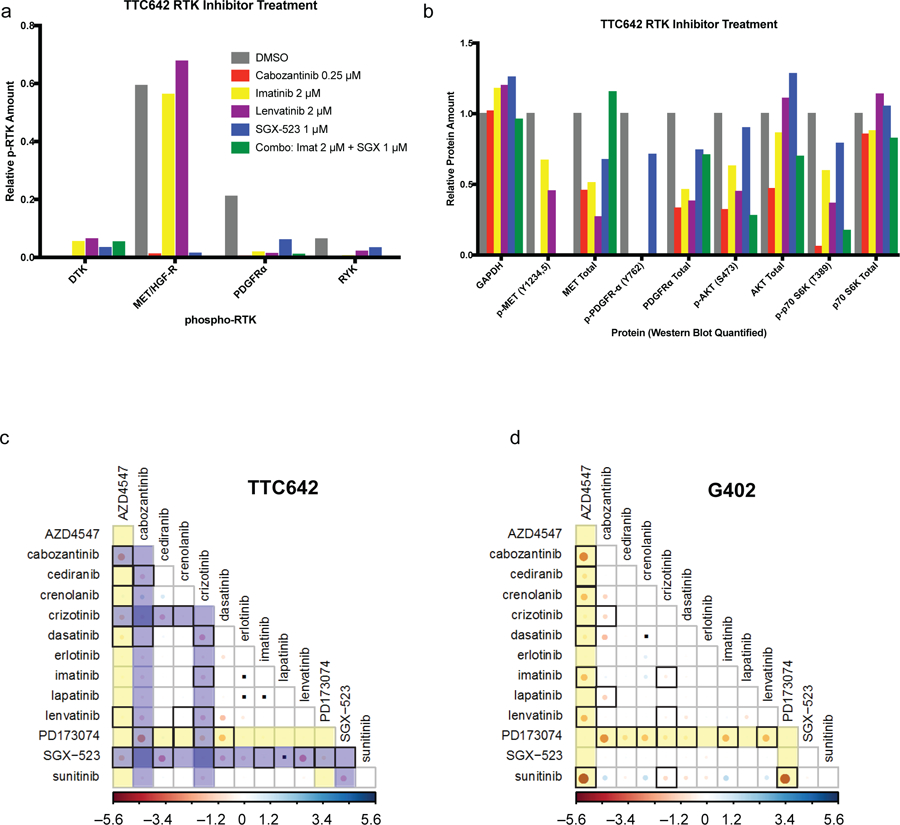
Combination of RTK inhibitors results in synergistic cell killing in RT CCLs.
a) TTC642 cells were treated with indicated inhibitors for three hours then subjected to phospho-RTK analysis with arrays. Relative phospho-RTK expression was quantified in ImageJ (see Figure S2d). b) Lysates from treated TTC642 cells were run for RTK pathway members by Western blot. Relative protein expression was quantified in ImageJ (see Figure S2d). (c-d) Pairwise combination treatments of 13 RTK inhibitors in c) TTC642 and d) G402 CCLs. FGFR inhibitors are highlighted in yellow. MET inhibitors are highlighted in blue. Red circles indicate synergistic interactions, with interactions exceeding a 99% confidence interval threshold surrounded by a black box. Inert combinations are indicated with black dots. Visualization was performed using the Corrplot package in R (see Figure S3).
