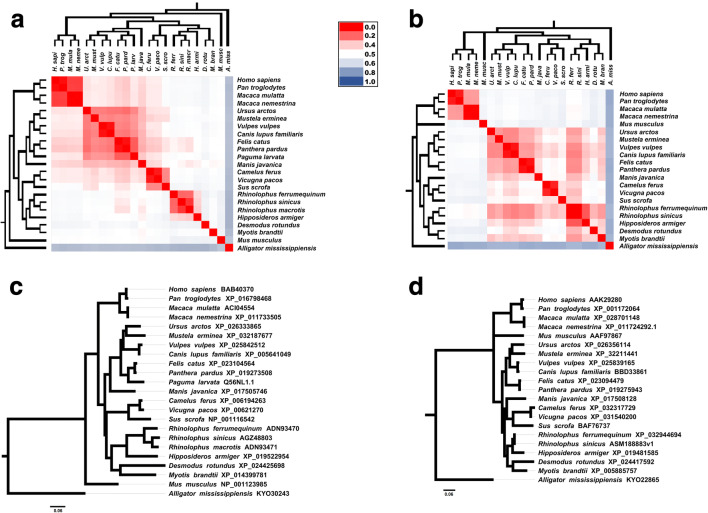
Fig. 2.
Evolutionary analysis of CoV hosts: ACE2 and TMPRSS2 Bayesian phylogenetic trees associated with evolutionary divergence matrix heat maps. The heat map color gradient represents the evolutionary divergence based on the number of amino acid substitutions/site from pairwise comparison between sequences, from low (red) to high (blue). a ACE2-based phylogeny and heat map matrix (n = 23) show a cluster with primates presented low evolutionary divergences. Malayan pangolin (Manis javanica) and civet (Paguma larvata) clustered with felids, canids, and others ones besides the clade composed by bat species. Pangolin and civet are phylogenetically close from bats than with humans. On the other hand, ACE2 heat map shows that both pangolin and civet are more divergent from bats than with humans. b TMPRSS2 evolutionary analysis presents close relationship between pangolin and civet with bats, while primates remained distant. c and d represent more detailed Bayesian consensus phylogenetic trees based on ACE2 and TMPRSS2 with supported values described. Analysis involved 23 amino acid sequences from ACE2 protein and 21 amino acid sequences from TMPRSS2 protein. All sequences were obtained from NCBI Protein database (www.ncbi.nlm.nih.gov/protein/). R. sinicus ASM188883v1 sequence was translated based on genome assembly obtained from NCBI Genome database (www.ncbi.nlm.nih.gov/genome/). (R. macrotis and P. larvata TMPRSS2 sequences were not available at the time of this analysis). Accession codes were included in each taxon name. Phylogenies were based on Bayesian analysis using JTT + G model (Jones-Taylor-Thornton model with a Gamma distribution for among-site rate variation) conducted by Mr. Bayes 3.2v [29]. Trees were searched for one million generations with sampling every 100 generations until the standard deviation from split frequencies were under 0.01. Scale bar indicates the number of substitutions/site for the trees. The parameters and the trees were summarized by wasting 25% of the samples obtained (burn-in). Phylogenetic trees were formatted with the FigTree v1.3.1 software (http://tree.bio.ed.ac.uk/software/figtree/). Evolutionary divergence between ACE2 and TMPRSS2 sequences were based on the number of amino acid substitutions per site from between sequences. Analyses were conducted using the JTT matrix-based model by MEGA X software [30], and heat maps were performed by Microsoft ExcelTM software

