
Fig. 20.
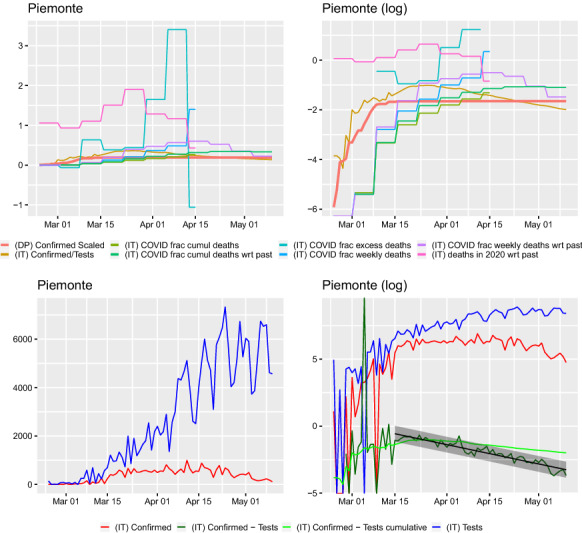
Comparison of curves for Piemonte region. Left: y–axis on normal scale, right: on logarithmic scale. Regression line shown for with prediction band. Slope of regression with confidence interval: , this corresponds to a half-life (in days) of 14.451(13.207, 15.954). The slope of the regression is corresponding to a half-life (in days) of 53.716(35.637, 109.020). The slope of the regression is 0.035(0.030, 0.052) corresponding to a doubling time (in days) of 19.769(13.415, 23.179). Ratio of slopes for , with corresponding half-lives’ ratio: 0.269. The slope of the regression is corresponding to a half-life (in days) of 39.243(35.548, 43.796)