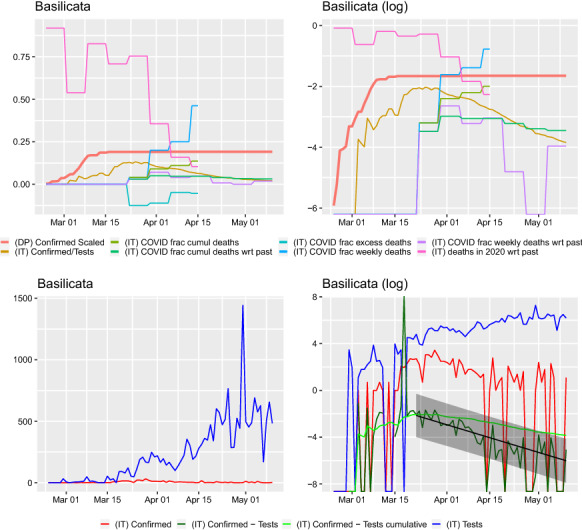
Fig. 8.

Comparison of curves for Basilicata region. Left: y–axis on normal scale, right: on logarithmic scale. Regression line shown for with prediction band. Slope of regression with confidence interval: , this corresponds to a half-life (in days) of 8.786(7.037, 11.693). The slope of the regression is corresponding to a half-life (in days) of 19.170(12.816, 38.025). The slope of the regression is 0.038(0.030, 0.028) corresponding to a doubling time (in days) of 18.446(24.860, 23.491). Ratio of slopes for , with corresponding half-lives’ ratio: 0.458. The slope of the regression is corresponding to a half-life (in days) of 16.866(16.265, 17.513)
