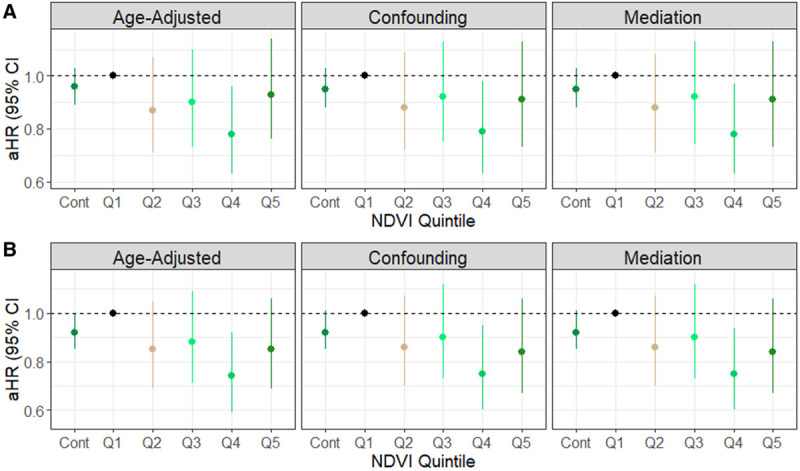
Figure 1.

Hazard ratios and confidence intervals for the association between baseline NDVI and lethal prostate cancer incidence in the Health Professionals Follow-up Study, United States, 1986–2014. Sequentially adjusted for age in months and calendar time as strata (Age-adjusted Model), race (categorical), diabetes mellitus (yes or no), height (categorical), family history of prostate cancer (yes or no), BMI at age 21 (categorical), smoking status in 1986 (categorical), 1990 census tract median income (USD), 1990 census tract median home value (USD), population density (binary: high: ≥1,000, low:<1,000 people/mi2), history of prostate-specific antigen testing, intensity of prostate-specific antigen testing (Confounding Model), vigorous physical activity, non-vigorous physical activity, and current BMI (Mediation Model). A, Total population (N = 47,958); (B) participants who did not move over follow-up (N = 42,492). Cont indicates an IQR increase in continuous NDVI of 0.11 units. Q, quintile.
