FIGURE 3.

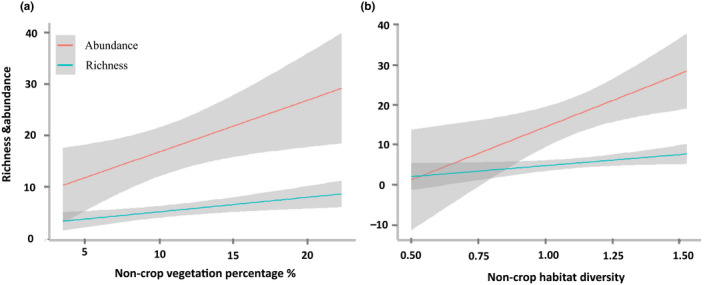
The effect of (a) proportion of noncrop vegetation (Non‐cropP) and (b) noncrop habitat diversity (Non‐cropH) on richness and abundance of woodland species. Grayed area represents a 95% confidence interval

The effect of (a) proportion of noncrop vegetation (Non‐cropP) and (b) noncrop habitat diversity (Non‐cropH) on richness and abundance of woodland species. Grayed area represents a 95% confidence interval