
FIGURE 4.
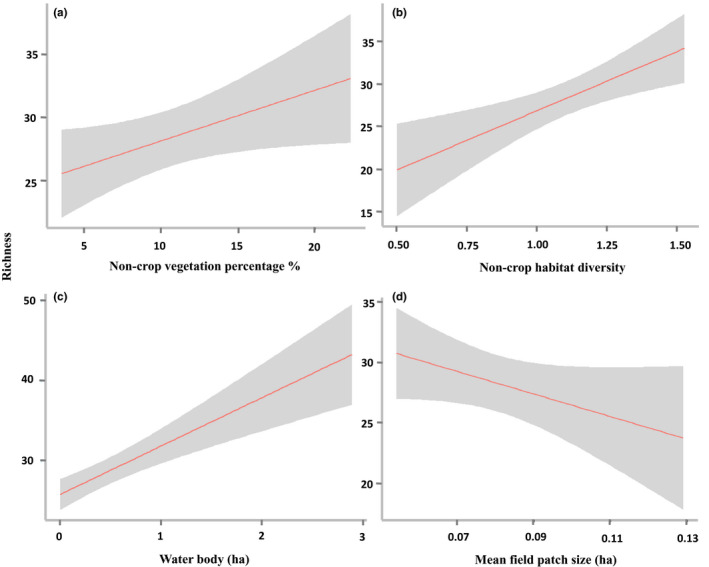
The effect of (a) proportion of noncrop vegetation (Non‐cropP), (b) noncrop habitat diversity (Non‐cropH), (c) area of water bodies, and (d) mean field patch size (MPS) on total species richness. Grayed area represents a 95% confidence interval