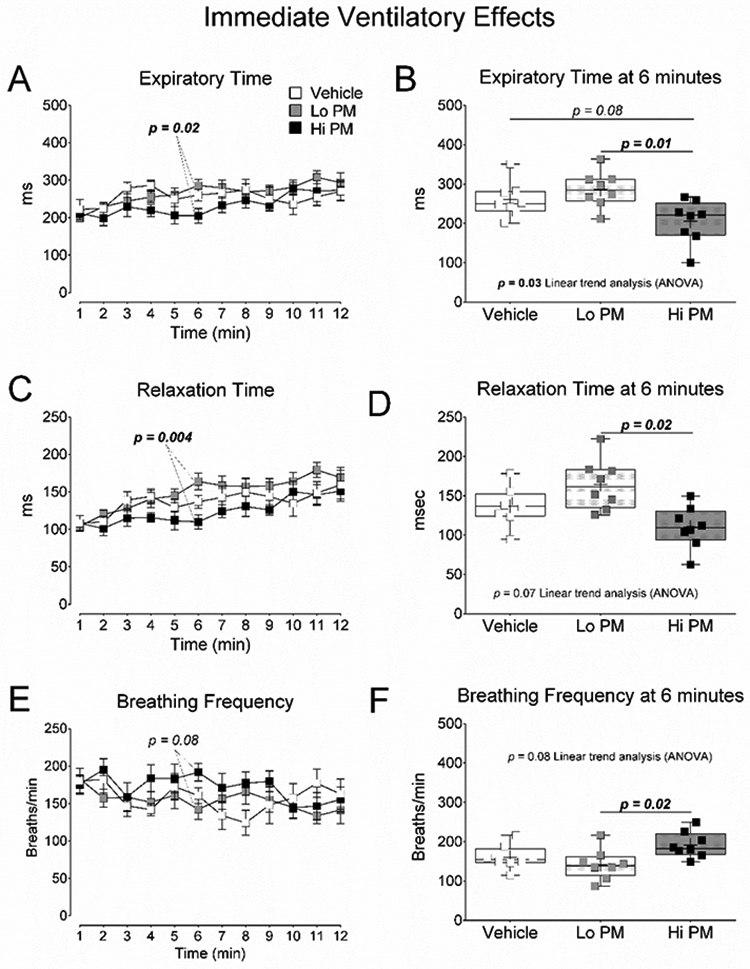
Figure 1. Ventilatory changes minutes after exposure to peat smoke PM.

(A) One-minute averages of expiratory time during the 12 minutes of ventilatory assessment. (B) Average expiratory time at 6 minutes. (C) One-minute averages of relaxation time during the 12 minutes of ventilatory assessment. (D) Average relaxation time at 6 minutes. (E) One-minute averages of breathing frequency during the 12 minutes of ventilatory assessment. (F) Average breathing frequency at 6 minutes. A, C, and E are mean ± SEM of one-minute averages tested by Repeated Measures ANOVA with Bonferroni’s post-test. B, D, and F were tested by One Way ANOVA with Tukey’s and linear trend analysis post-tests. p-values less than 0.1 are provided for clarity.
