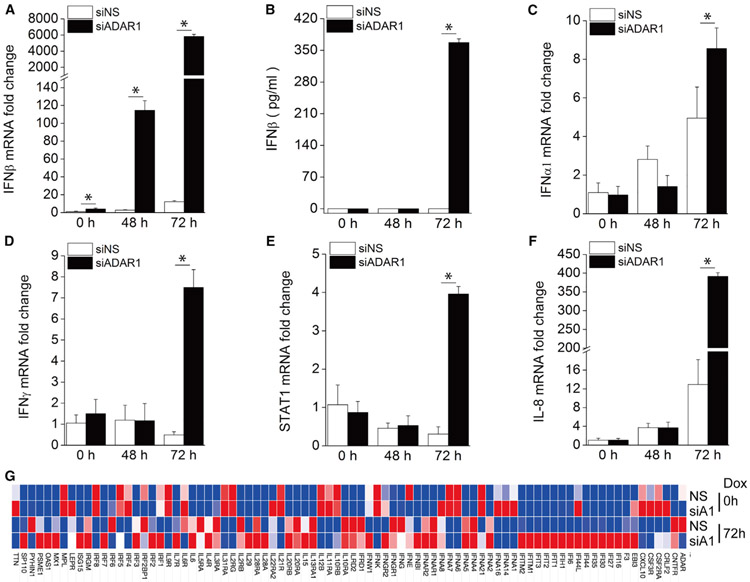
Figure 2. Knockdown of ADAR1 Increases Type I IFN and Cytokine Production during KSHV Reactivation.
iSLK.219 cells were transfected with NS or ADAR1 siRNA for 48 h and then treated with Dox (0.2 μg/mL) for 0, 48, and 72 h.
(A) The fold induction of IFNβ mRNA expression level was measured by real-time PCR.
(B) IFNβ production in the supernatant was measured by ELISA.
(C–F) The mRNA expression of the IFNα1 (C), IFNγ (D), STAT1 (E), and IL-8 (F) genes was measured by real-time PCR, and the fold change was normalized to β-actin mRNA.
(G) Heatmap of the Human Interferons & Receptors PCR array. RNA was extracted from the indicated samples, and the mRNA levels of the indicated genes were analyzed using the Human Interferons & Receptors RT2 Profiler PCR Array. The mRNA levels of genes were normalized to β-actin. The heatmap was generated using the web-based tool Morpheus (https://software.broadinstitute.org/morpheus/).
The data shown are representative of three independent experiments, except for (G), which is representative of two experiments. Data from (A)–(F) are presented as mean ± SD. *, p < 0.05 by Student’s t test. A1, ADAR1.

