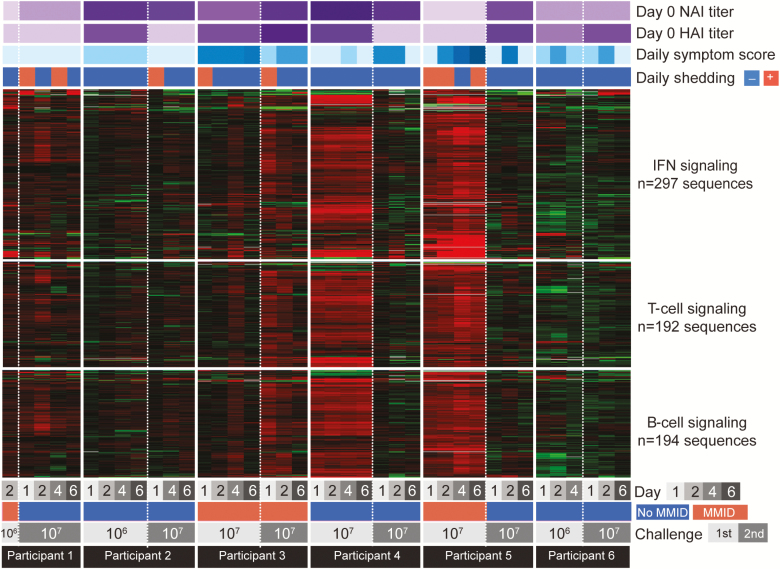
Figure 1.
Expression of type I interferon (IFN), T-cell, and B-cell signaling genes during A(H1N1)pdm09 influenza challenge 1 and challenge 2. Heatmap diagram showing expression profiles of type I IFN, T-cell, and B-cell signaling immune response pathway genes. For each participant, gene expression analysis was performed by expression microarray, and gene expression on days post–viral challenge was normalized to each participant’s baseline (day 0) expression values. Expression of genes shown in red was increased, and expression of genes shown in green was decreased relative to each participant’s day 0 expression, with black indicating no relative change in expression following A(H1N1)pdm09 virus inoculation. Each participant’s preexisting neuraminidase inhibition (NAI) and hemagglutination inhibition (HAI) titers, daily symptom score, viral shedding status, and clinical outcome (mild to moderate influenza disease [MMID] or no MMID) and challenge 50% tissue culture infectious dose (TCID50) are also shown. Global gene expression analysis was not performed in challenge 1 for participant 7 who received a 103 TCID50 dose due to the absence of samples.

