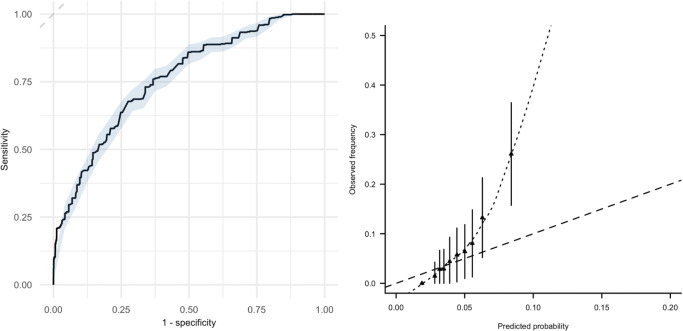
Fig 3. Discrimination and calibration of the Vienna Prediction Model.
Left panel: discriminative performance of the Vienna Prediction Model with 95% CI (blue shading): c-statistic 0.76 (95% CI 0.74 to 0.78). Right panel: calibration plot comparing predicted risk of recurrent venous thromboembolism by the Vienna Prediction Model (x-axis) with observed recurrence rate (y-axis).

