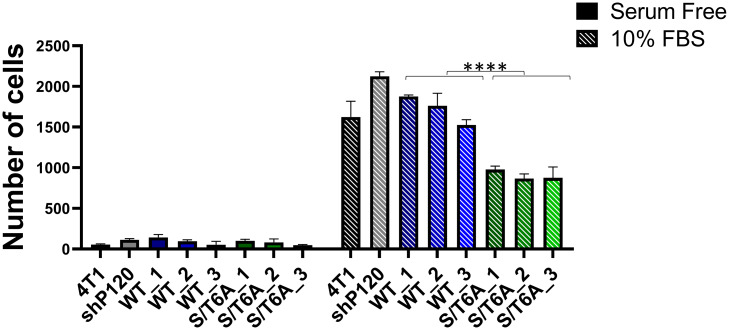
Fig 5. Effect of p120-catenin phosphorylation state on cell migration in response to growth factors.
Quantification of the number of cells migrated to the bottom of the filter in a transwell migration assay when the lower chamber is filled with 10% FBS media versus serum free media. Data was analyzed using one-way ANOVA followed by Tukey’s multiple comparison tests (S3 Table) followed by two-way ANOVA between WT and S/T6A clones. P values are represented by asterisks where: * ≤0.05 and ****≤0.0001.

