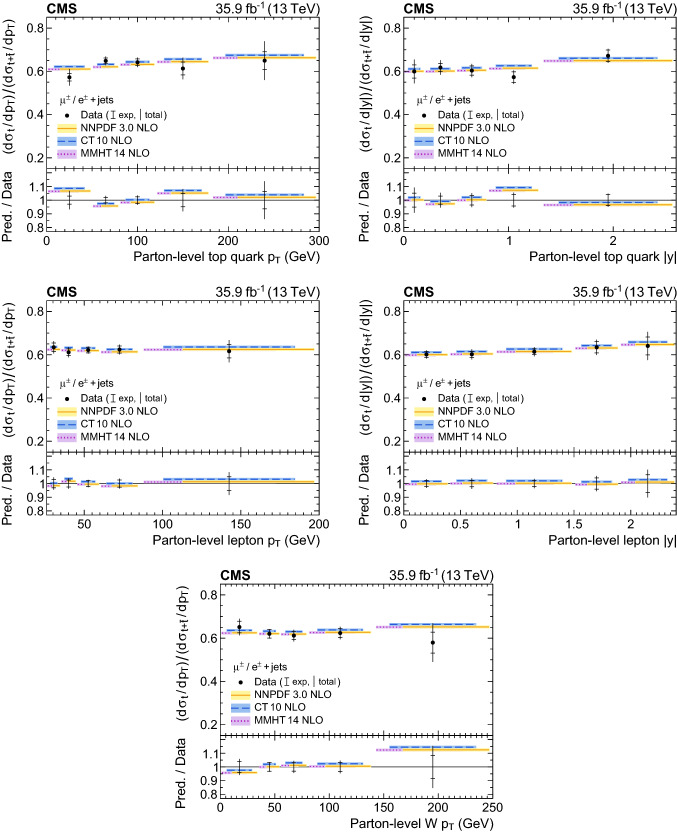
Fig. 11.
Ratio of the top quark to the sum of the top quark and antiquark differential cross section at the parton level: (upper row) top quark and rapidity; (middle row) charged lepton and rapidity; (lower row) boson . The total uncertainty is indicated by the vertical lines, while horizontal bars indicate the statistical and experimental uncertainties, which have been profiled in the ML fit, and thus exclude the uncertainties in the theoretical modelling. Predictions from three different PDF sets are shown by the solid, dashed, and dotted lines. The lower panels show the ratios of the predictions to the data

