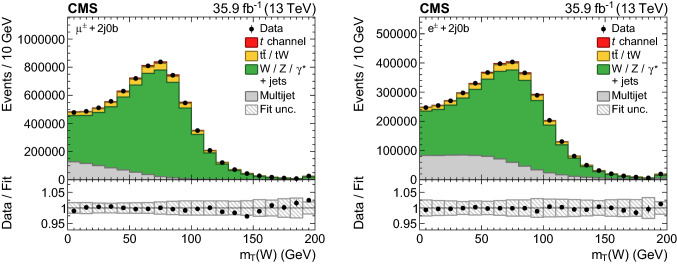
Fig. 2.
Distributions of the transverse boson mass in the 2 jets, 0 b tag control category for the (left) muon and (right) electron channels after scaling the simulated and multijet templates to the result of a dedicated ML fit performed on this category of events. The hatched band displays the fit uncertainty. The lower plots give the ratio of the data to the fit results. The right-most bins include the event overflows

