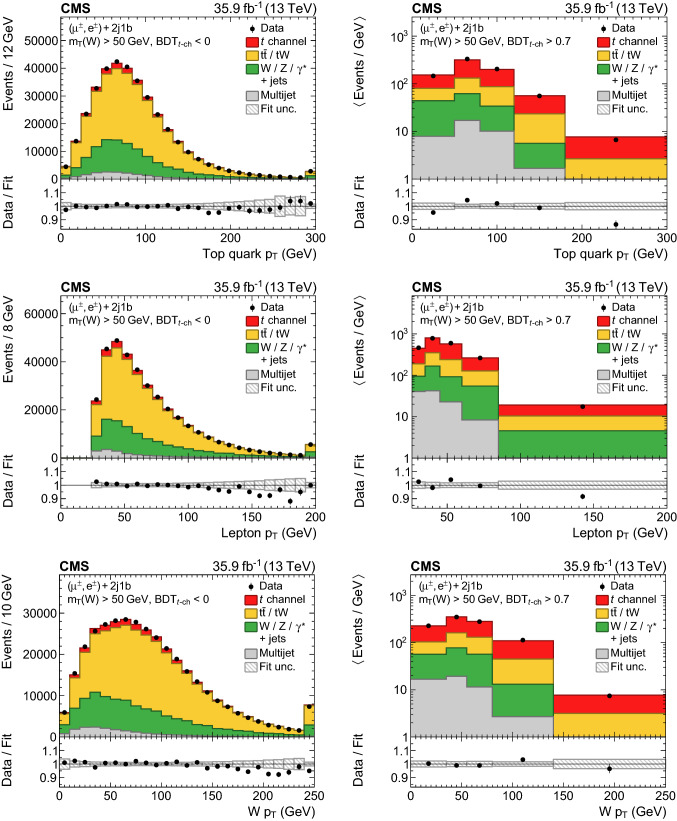
Fig. 5.
Distributions of the observables in a (left column) background-dominated and a (right column) signal-enriched region for events passing the 2 jets, 1 b tag selection: (upper row) top quark ; (middle row) charged lepton ; (lower row) boson . Events in the muon and electron channels have been summed. The predictions have been scaled to the result of the inclusive ML fit and the hatched band displays the fit uncertainty. The plots on the left give the number of events per bin, while those on the right show the number of events per bin divided by the bin width. The lower panel in each plot gives the ratio of the data to the fit results. The right-most bins include the event overflows

