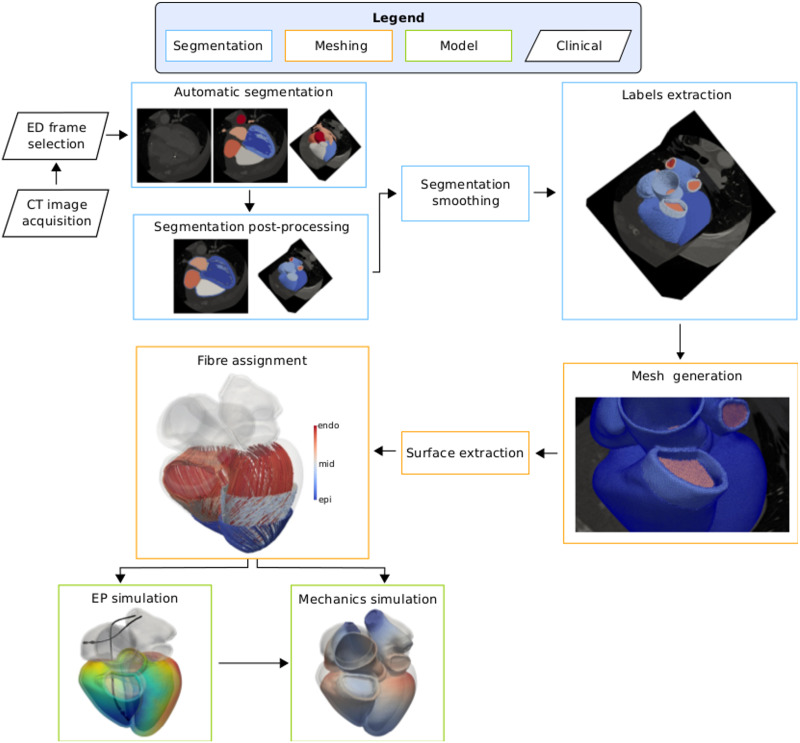
Fig 1. Pipeline.
CT images were acquired in 10 or 20 frames over a whole cardiac cycle. The end-diastolic (ED) geometry was then selected and automatically segmented [31]. The resulting segmentation was post-processed to generate labels representing the RV, LA and RA myocardium, the wall thickness for the aorta and the pulmonary artery, valve planes and rings at the cropped veins. The surface of the segmentation was then smoothed [37] and all the labels but the blood pools and the LV papillary muscles were extracted to generate a tetrahedral mesh. We extracted the endocardial and epicardial surfaces of the atria and ventricles and we assigned fibre orientation to the ventricles with a rule-based method [38]. Finally, we simulated electrical activation and mechanical contraction of the ventricles to test the usability of the meshes.

