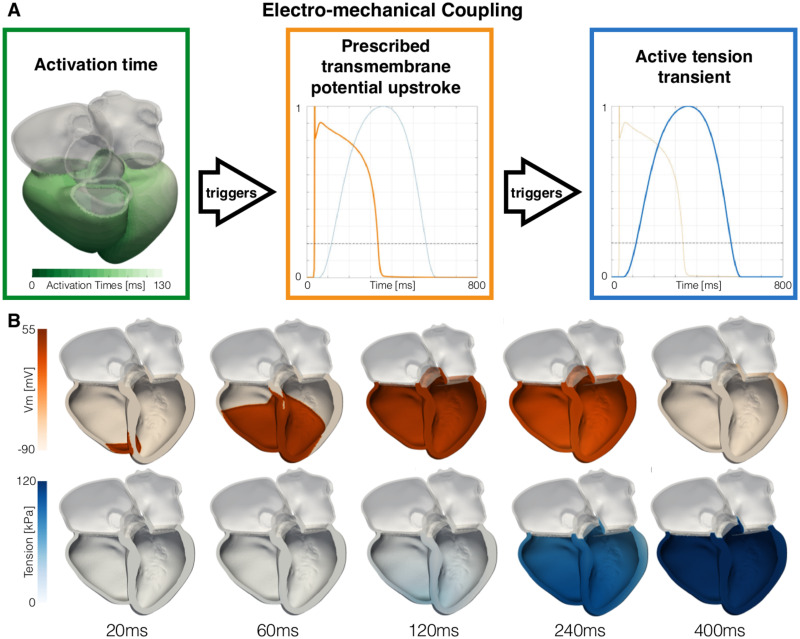
Fig 5. Electro-mechanical coupling.
A The activation times computed by the eikonal model (shown on mesh 01 in the green box) trigger an upstroke in transmembrane potential Vm at each node of the mesh (orange curve in the orange box). When the transmembrane potential overcomes -60mV (black dashed line), the rise in active tension is triggered (blue curve in the blue box). B We show the changes in transmembrane potential (top row) and the active tension (bottom row) over time on mesh 01.

