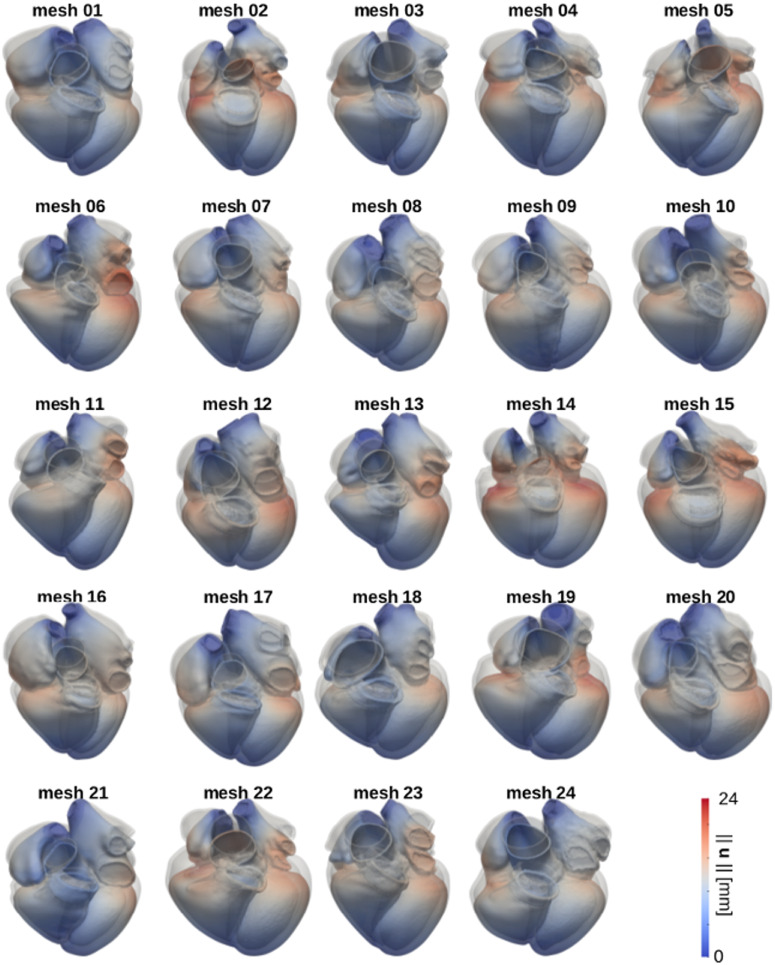
Fig 8. Simulated free active contraction.
The images show the results for the free contraction simulations run on all meshes. For each mesh, we show the configuration at the end of LV systole (coloured according to the magnitude of the displacement vector ||u|| in mm) and the initial configuration (grey geometry).

