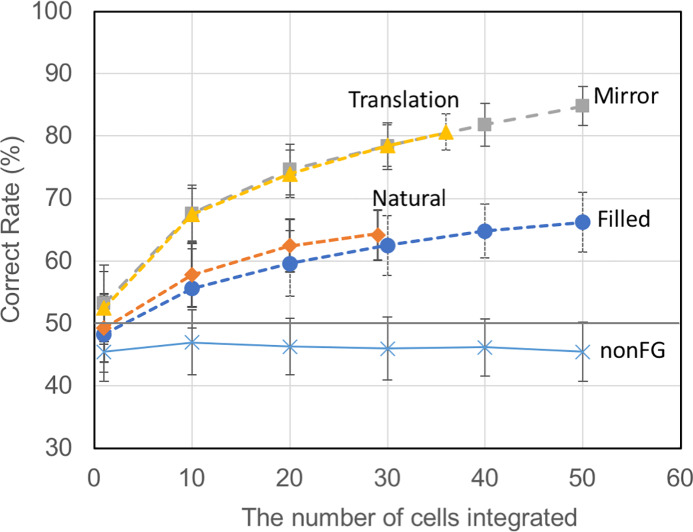
Fig 6. The computed correct rates of FG classification across stimuli as a function of the number of integrated neurons.
The computed correct rates from the responses of neurons with FG significance for the filled patches (blue circles), natural patches (red diamonds), paired-mirror patches (grey squares), paired-translation patches (yellow triangles) and those of neurons without FG significance (blue crosses). The correct rate increases as the number of integrated neurons increases when FG-significant cells were pooled. The simulation was repeated 200 times for every condition with randomization. The graphs show the mean across the simulations, and the error bars show the standard deviation. Note that the correct rates for single cells (1 on the abscissa) are often below chance (50%) because of the cross validation used in the SVM computation (refer to “Support vector machine” section).

