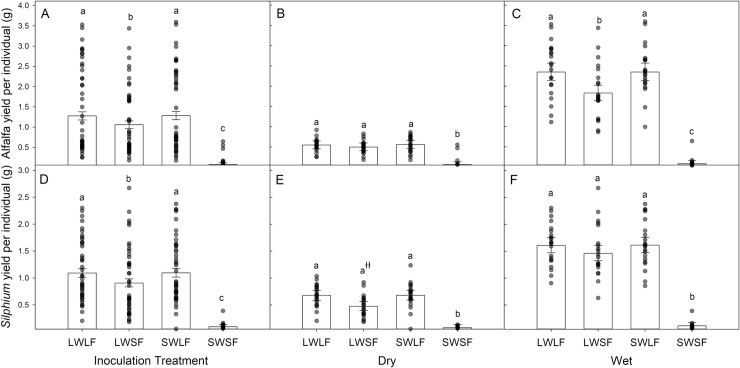
Fig 2.
Average yield per individual biomass (back transformed LS Mean grams ± 95% Confidence Limits) of alfalfa (A - C) and Silphium (D – F) in the soil inoculation treatments (A and D; LW=living whole soil, SW= sterilized whole soil, LF= living prairie AM fungi, SF=sterilized prairie AM fungi) and in the soil inoculation treatments with dry (B and E) and wet (C and F) water treatments. The dots are the observed responses for each treatment. Bars with different letters within each graph are significantly different (Tukey’s HSD multiple comparison). ƚƚ The Tukey’s comparisons of LWSF vs LWLF and LWSF vs SWLF in panel E were marginally significant (P = 0.06) but the interaction of water x inoculum (Panel E vs F) was substantially significant (P <0.0001; Table 1).

