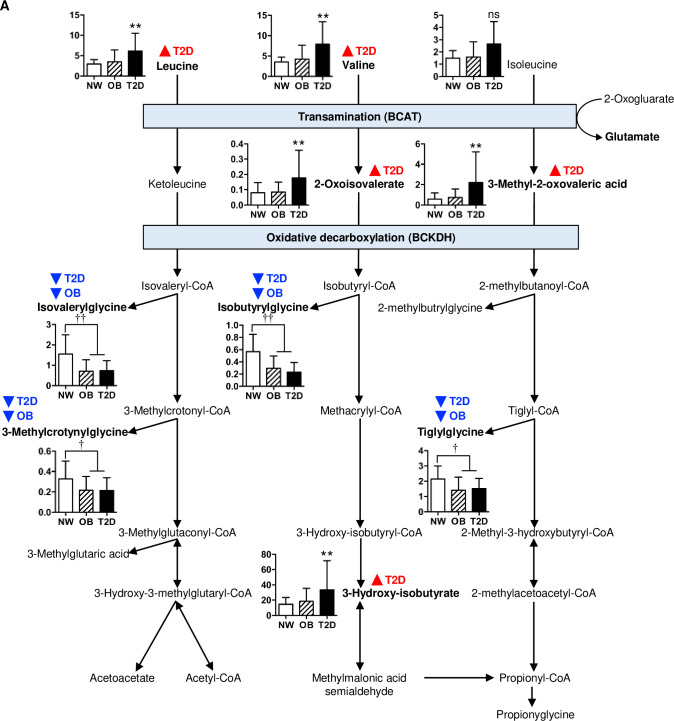
Fig 2. Urinary BCAA metabolites in NW, OB and T2D subjects.
Urinary BCAAs and their immediate catabolites were increased in diabetic youth, but BCAA acylglycine derivatives were decreased in youth with obesity regardless of diabetes status. BCAA degradation pathways are shown. Red triangle symbols with T2D indicate post-hoc Tukey T2D>OB and T2D>NW. Blue triangle symbols with T2D indicate post-hoc Tukey T2D<NW, and blue triangle symbols with OB indicate post-hoc Tukey OB<NW. Bar charts show mean urinary metabolite concentrations ± SEM expressed as mmol/mmol creatinine: white bars, NW; hatched bars, OB; solid bars, T2D. **p<0.01 T2D vs. NW and T2D vs. OB, †p<0.05 compared to NW, ††p<0.01 compared to NW.

