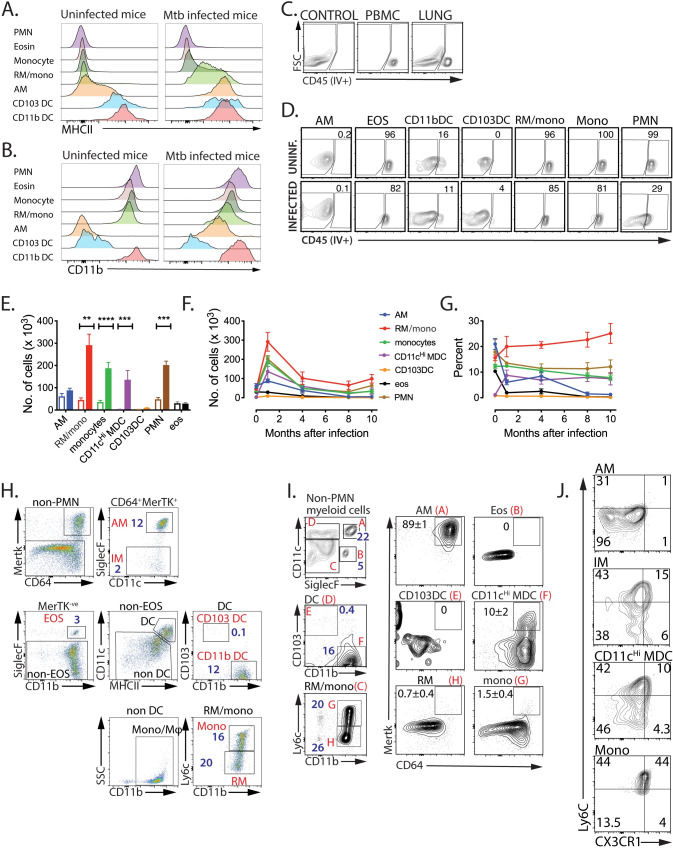
Fig 1. Expression of MHCII and CD11b are increased by AM during Mtb infection.
A, B. MHCII is significantly upregulated on AM after Mtb infection. C57BL/6 mice were infected by aerosol with ~100 Rv.YFP. After 4 weeks, lung myeloid cells collected from infected mice were compared with those from uninfected mice for the expression of MHCII (A) and CD11b (B) on each myeloid cell subset. C, D. Each myeloid subset populates a distinct anatomical site. Six weeks after infection, mice were injected i.v. with fluorophore-labelled anti-CD45 mAb 3 min before euthanasia. (C, D) “Control” denotes lung cells from an uninjected mouse. PBMC was used to measure the efficiency of vascular staining. Nearly 50% of lung cells were in the vasculature. Each myeloid cell subset was analyzed for its staining with anti-CD45 mAb. E. Myeloid populations selectively expand after infection. Total lung cells were obtained from uninfected mice or mice infected with Rv.YFP for 3 weeks. 3 wpi, the total number of cells was increased in CD11cHi MDC, RM/mono, monocytes, and PMN after infection, but the number of AM, CD103 DC, and EOS remained unchanged. Each value represents the average of 5 mice. F, G. The number and relative abundance of RM/mono, monocytes, PMNs, and CD11cHi MDC, peaked 1 month after infection and then declined. Each value represents the average of 5 mice. H: IMs constitute a small fraction of the lung myeloid cells, after 3 weeks post aerosol Mtb infection. The gating scheme used by Huang et al. was used to identify IM (defined as CD64+MertK+SiglecF- non-PMN myeloid cells). The numbers refer to the percentage of each cell population among non-PMN myeloid cells. I. CD11cHi MDC overlap with IM. Using our gating scheme, we define the percentage of each cell population among non-PMN myeloid cells (left, blue numbers). The expression of CD64 and MertK is determined for each major cell population, and the percentage of CD64+MertK+ cells is indicated by the black numbers. J. AM, IM, CD11cHi MDC, and Mono were analyzed for the expression of CX3CR1 and Ly6C, markers for monocyte-derived cells. These results are representative of 5 (A-D), 2 (E), 2 (F, G), 2 (H-J) experiments. The SD for Fig 1D, 1H, 1I and 1J are not shown for clarity, but were generally <10% of the mean. PMN, neutrophils; EOS or eosin, eosinophils; Mono, monocytes; RM, recruited macrophages, AM, alveolar macrophages; CD103DC, cDC1; CD11bDC, cDC2; CD11cHi MDC, CD11cHi monocyte-derived cells. **, p<0.01, ***, p<0.001, p<0.0001, by a two-way ANOVA.

