Figure 2.
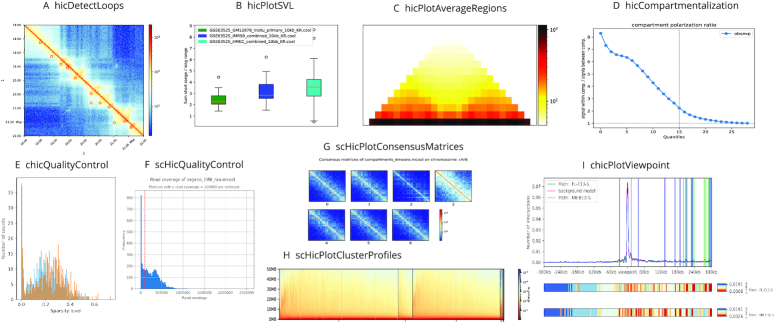
(A) Detected loops on GM12878 primary data from (9), computed by hicDetectLoops and visualised by hicPlotMatrix. (B) Short to long range contact interaction ratios created by hicPlotSVL on GM12878 primary, IMR90 and HMEC data from (9). (C) Average regions of detected TADs from hicFindTADs on GM12878 primary, chromosome 1; data from (9). (D) The level of compartments separation on GM12878 primary data from (9), computed by hicCompartmentalization. (E) Quality control plot for FL-E13-5 and MB-E10-5 showing the sparsity distribution, data from (42). (F) Quality control plot for single-cell Hi-C data by (36). It shows the read coverage per cell, cells with <100 000 reads are discarded. (G) Consensus matrix plot for single-cell Hi-C data on 1 Mb resolution. Cells are dimension reduced by computing A/B compartments per cell and clustered with k-means. The consensus matrix of a cluster is the average of all interaction matrices of the cluster members. Data from (36). (H) Single-cell Hi-C cluster profile, created after dimension reduction by scHicClusterMinHash and spectral clustering on 1 Mb single-cell Hi-C data from (36). (I) Viewpoint of the gene MSTN on FL-E13-5 and MB-E10-5 with mean background and p-values per relative distance via continuous negative binomial distributions, data from (42).

