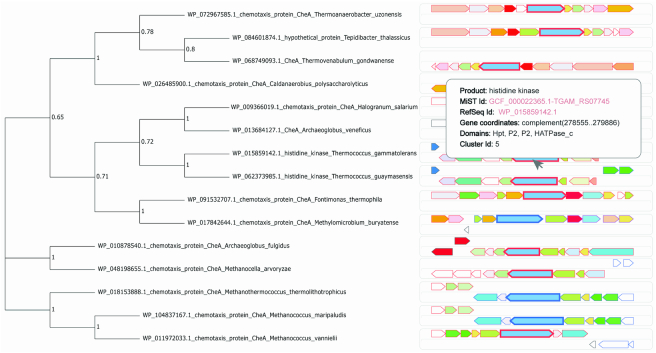
Figure 3.
Phylogenetic tree of a subset of CheA kinase homologs and their corresponding gene neighborhoods generated by TREND. Genes that encode proteins consisting of the same domains are shown in the same color: cheA genes are shown in blue. Genes encoding proteins from corresponding branches of the phylogenetic tree (left panel) are marked with bold borders (in this case, cheA genes).

